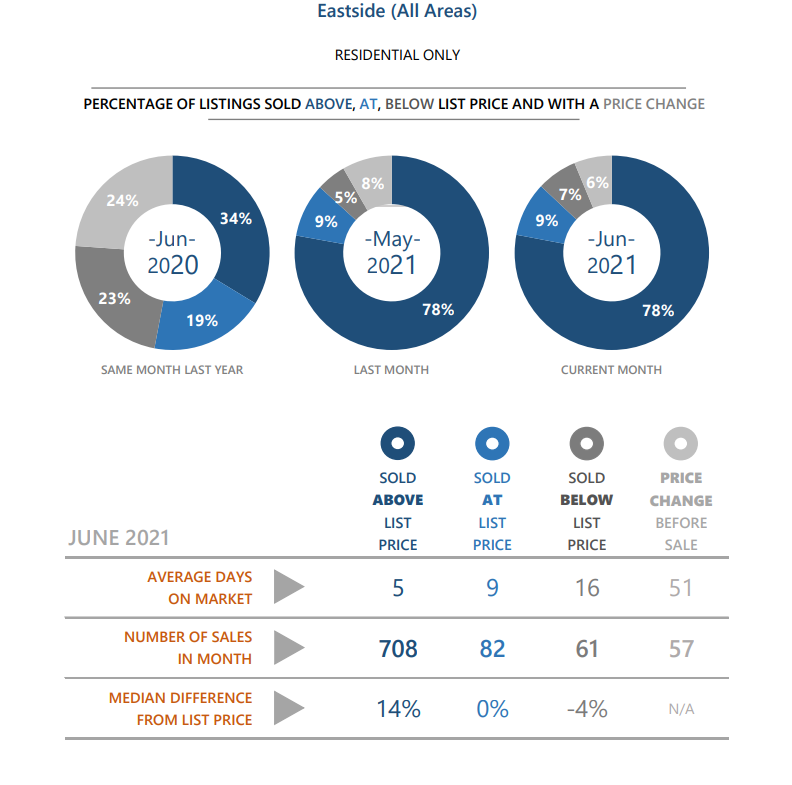
The June statistics show more of the same…..astonishing statistics:
• Median closed sales price $1,364,000 up 40%
• 78% of homes sold for over the list price. The median over list price paid was 14%.
• 92% of properties that sold had less than 15 days on market.
Looking for signs that our prediction (written in May. Copy below), that Buyers would experience “minor”
relief:
• Median closed sales price for the past four months are relatively flat when compared to the
40% year over year increase: $1,350,000 (March), $1,300,000 (April), $1,298,475 (May), and
$1,364,000 (June).
• The percentage of homes sold for over the list price peaked in March and historically drops
from April through December (see page 3 below).
• June had the most new listings this year. July is historically is the third highest number of
new listings behind May and June


The market is so low on inventory that historic norms may not occur. If norms do occur, buyers may
experience minor relief.
• May, June and July are the top three new listings months.
• Historically the percentage of homes selling over list price decreases after April.
• Median closed sale price generally flatten out in the second half of the year.
• Monthly payments, based on the average King County Residential sales price and prevailing 30
year interest rates, as a percentage of an inflationary trend line are approaching previous market
highs (136 vs 140 and 151)


 Facebook
 X
X
 Pinterest
 Copy Link
