The Eastside market is more balanced than it’s been in years—prices have softened and inventory is up, but homes are still selling, the sky isn’t falling, and smart pricing (for sellers) and confident, strategic buying (for buyers) wins the day.
We’re starting the year with 67% more inventory than this time last year, which sounds alarming—but context matters. At 2.6 months of inventory, we’re still solidly in a balanced market, so there’s no need to panic. One of my favorite housing economists keeps saying we’re “back to a 2019 market.” On the Eastside, we actually have 13% more inventory than in 2019, and back then inventory sat at 1.4 months. So… I’m still chewing on that comparison.
Historically, the first quarter tends to start with a bang, though it’s too early to know if that pattern will hold. One wildcard: a meaningful number of sellers chose to cancel listings late last year with plans to relist in 2025. If that’s the case, some of today’s inventory may simply be deferred from Q4. As always—time will tell.
It’s also worth noting that the Eastside is lagging King County overall, which currently sits at 2.1 months of inventory and is “only” 36% higher than last year (and 19% higher than 2019). So while inventory is elevated across the board, the Eastside is feeling it a bit more.
With about half of homes selling within 30 days, the sky is clearly not falling. That said, 57% of sellers needed a price reduction to get sold, so yes—pricing has softened. January is a notoriously wonky month for median price data, but we’re currently down 3% year over year (and up 5% month over month—though that follows an 8% drop the month prior). Zoom out a bit further and the picture changes: since 2020, Eastside prices are up 36%, averaging roughly 7% per year, or about $400,000. Not too shabby.
So what does this all mean?
First: the sky isn’t falling. Sellers should approach the market as both a price war and a beauty competition. Buyers can buy with confidence—and if possible, go against the grain. Homes that others overlook often offer the best opportunities (easier said than done, I know).
I’m very curious to see how the rest of January unfolds
Months of inventory — how we take the pulse of the market — are down based on pending sales. That’s not surprising, given September’s dip in interest rates ahead of the Fed Funds rate cut, which temporarily boosted buyer confidence. That said, the last two weeks have slowed buyers down. Economic uncertainty isn’t great for decision-making (which, ironically, is exactly what makes now a great time to buy — more on that later).
Median prices are up 2% month-over-month and 3% year-over-year. Interest rates are hovering between 6% and 6.5%, and realistically, that’s probably where they’ll stay for the foreseeable future. (Reason #2 not to delay buying.)
At 2.3 months of inventory, we’re in a balanced market with a slight lean toward sellers. However, we still have more active inventory than we’ve seen in the last five years — (Reason #3 to buy now.) Homes that are well priced are selling fast — 12% of the market sold in the first weekend. But if a home has challenges that pricing doesn’t account for, or it’s simply overpriced, it won’t move without a reduction.
What does this mean?
Sellers: Price conservatively (yes, that means low).
Buyers: Honestly, now is the time — as long as you can afford the payment and plan to stay 3+ years (ideally 5+). Inventory is solid, rates are likely to hold (and can be refinanced later), and economic uncertainty is causing other buyers to pause. That combination creates opportunity.
Year-over-year, median prices are basically flat, but they did slip month-over-month for the 4th month in a row. As always, take pricing with a grain of salt—it’s one of the trickiest stats to pin down. With September’s burst of activity and (slightly) lower interest rates, buyer demand will likely keep prices steady through the rest of the year.
Inventory now sits at 2.5 months—technically a balanced market. But here’s the kicker: this is the first time in a decade we’ve seen August’s months of inventory at this level. It feels dramatic because it’s new, but it’s not doomsday. Think of it as shifting from the freeway fast lane at 85 mph down to a solid 55 mph. Is it slower? Sure. But you’re still moving forward.
And the sky? Definitely not falling. Roughly one-third of homes are still selling at or above asking, and two-thirds are going under contract within 30 days. That’s not weakness—it’s recalibration toward a healthier, more sustainable pace.
Buyers: enjoy the breathing room, but stay sharp—19% of homes still sold with multiple offers last month.
Sellers: pricing and presentation matter more than ever. Nail both in the first two weeks if you want top results.
The Federal Reserve (the Fed) meets this week, and expectations are high that they’ll cut the Federal Funds Rate. But does that mean mortgage rates will drop? Let’s clear up the confusion.
The Fed Doesn’t Directly Set Mortgage Rates
Right now, all eyes are on the Fed. Most economists expect they’ll cut the Federal Funds Rate at their mid-September meeting to try to head off a potential recession.
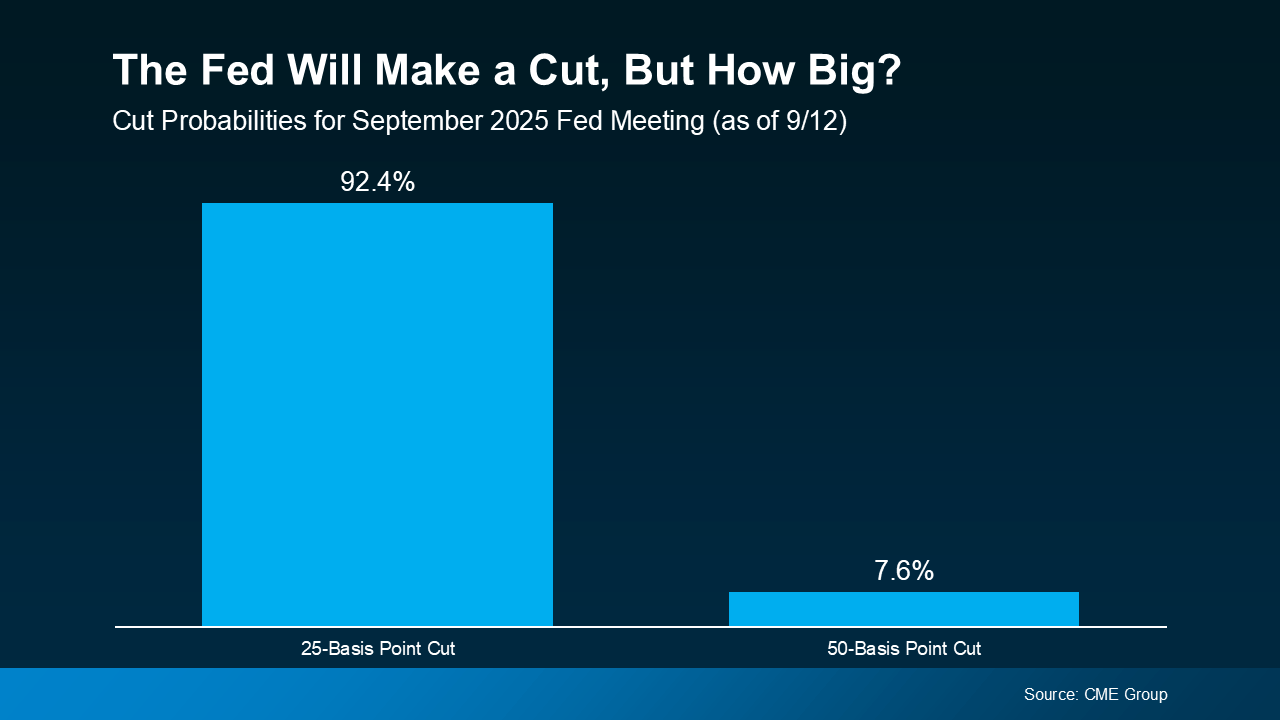
According to the CME FedWatch Tool, markets are already betting on it. There’s virtually a 100% chance of a September cut. And based on what we know now, there’s about a 92% chance it’ll be a small cut (25 basis points) and an 8% chance it will be a bigger cut (50 basis points):
So, what exactly is the Federal Funds Rate? It’s the short-term interest rate banks charge each other. It impacts borrowing costs across the economy, but it’s not the same thing as mortgage rates. Still, the Fed’s actions can shape the direction mortgage rates take next.
Why Markets Already Saw This Cut Coming
Here’s the part that may surprise you. Mortgage rates tend to respond to what the financial markets think the Fed will do, before the Fed officially acts. Basically, when markets anticipate a Fed cut, that outlook gets priced into mortgage rates ahead of time.
That’s exactly what happened after weaker-than-expected jobs reports on August 1 and September 5. Each time, mortgage rates ticked down as financial markets grew more confident a cut was coming soon. And even though inflation rose slightly in the latest CPI report, the Fed is still expected to make a cut.
So, if the Fed goes with a 25-basis point cut, as expected, that’s likely already baked in to current mortgage rates, and we may not see a dramatic drop.
But if they go bigger and drop their Federal Funds Rate by 50 basis points instead, mortgage rates could come down more than they already have.
So, Where Do Mortgage Rates Go from Here?
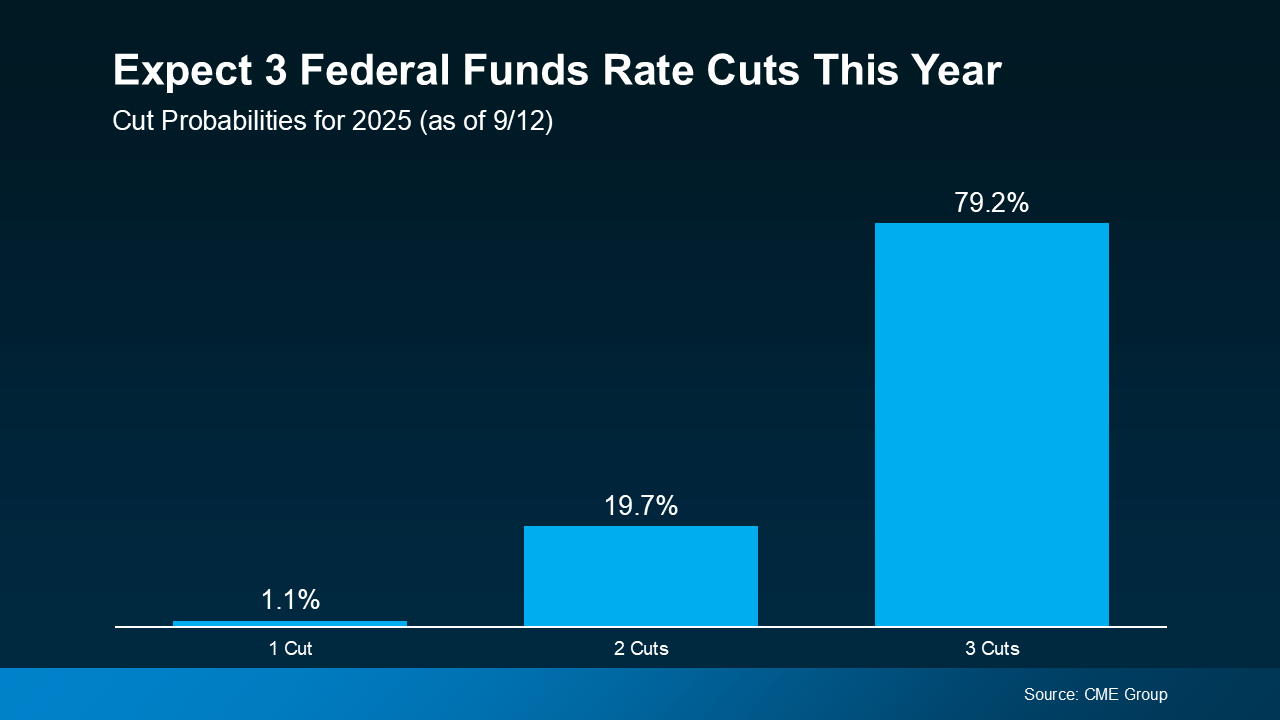
While the upcoming cut may not move the needle much, many experts expect the Fed could cut the Federal Funds Rate more than once before the end of the year. Of course, that’s if the economy continues to cool (see graph below):
As Sam Williamson, Senior Economist at First American, explains:
“For mortgage rates, investor confidence in a forthcoming rate-cutting cycle could help push borrowing costs lower in the back half of 2025, offering some relief to housing affordability and potentially helping to boost buyer demand and overall market activity.”
If multiple rate cuts happen, or even if markets just believe they will, mortgage rates could ease further in the months ahead. But here’s the catch – all of this depends on how the economy evolves. Surprise inflation data or unexpected shifts could quickly change the outlook.
Bottom Line
Mortgage rates likely won’t drop sharply overnight, and they won’t mirror the Fed’s moves one-for-one. But if the Fed begins a rate-cutting cycle, and markets continue to expect it, mortgage rates could trend lower later this year and into 2026.
If you’ve been waiting and watching the housing market, now’s the time to talk strategy. Even small changes in rates can make a meaningful difference in affordability, and understanding what’s ahead helps you make the best decision for your situation.
You may have seen talk online that new home inventory is at its highest level since the crash. And if you lived through the crash back in 2008, seeing new construction is up again may feel a little scary.
But here’s what you need to remember: a lot of what you see online is designed to get clicks. So, you may not be getting the full story. A closer look at the data and a little expert insight can change your perspective completely.
Why This Isn’t Like 2008
While it’s true the number of new homes on the market hit its highest level since the crash, that’s not a reason to worry. That’s because new builds are just one piece of the puzzle. They don’t tell the full story of what’s happening today.
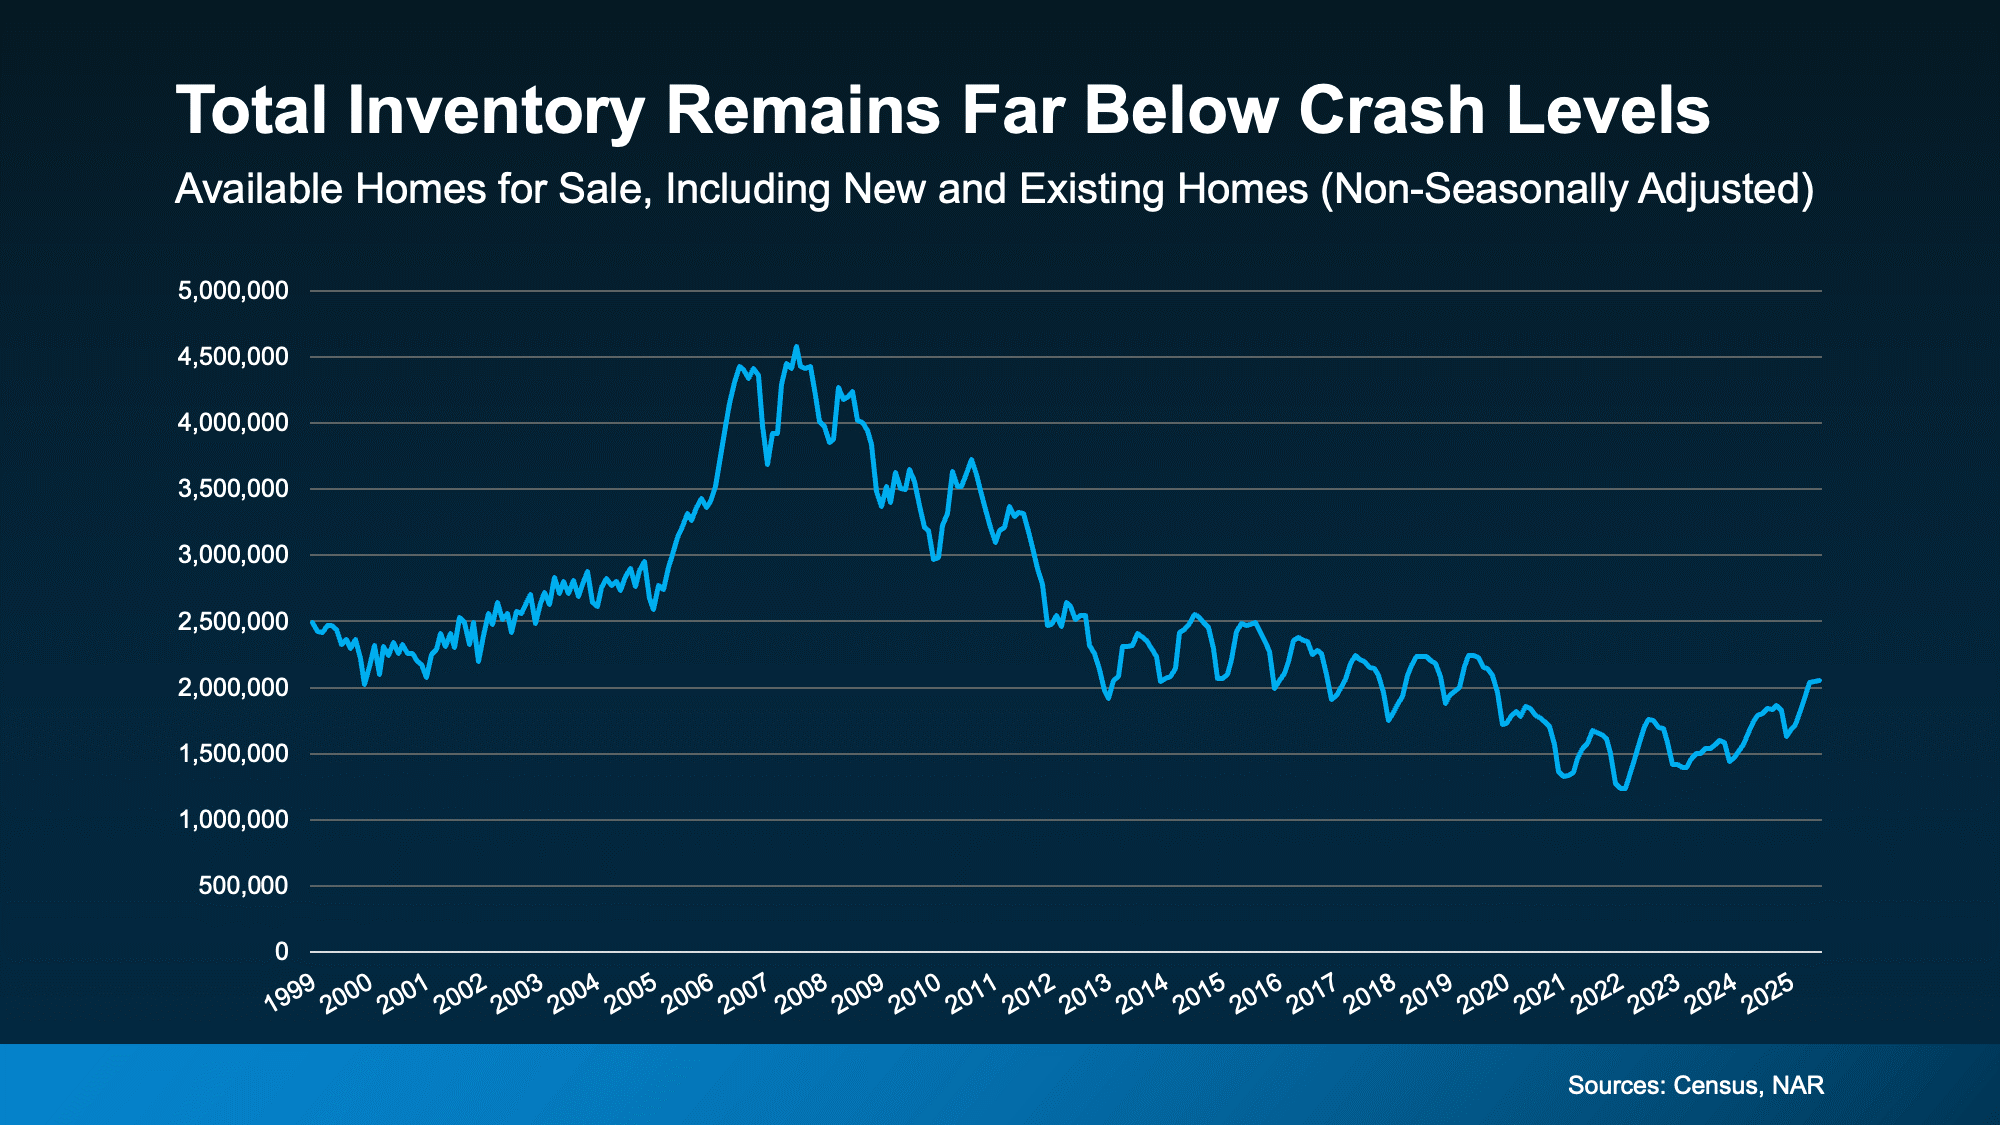
To get the real picture of how much inventory we have and how it compares to the surplus we saw back then, you’ve got to look at both new homes and existing homes (homes that were lived in by a previous owner).
When you combine those two numbers, it’s clear overall supply looks very different today than it did around the crash (see graph below):
So,saying we’re near 2008 levels for new construction isn’t the same as the inventory surplus we did the last time.
Builders Have Actually Underbuilt for Over a Decade
And here’s some other important perspective you’re not going to get from those headlines. After the 2008 crash, builders slammed on the brakes. For 15 years, they didn’t build enough homes to keep up with demand. That long stretch of underbuilding created a major housing shortage, which we’re still dealing with today.
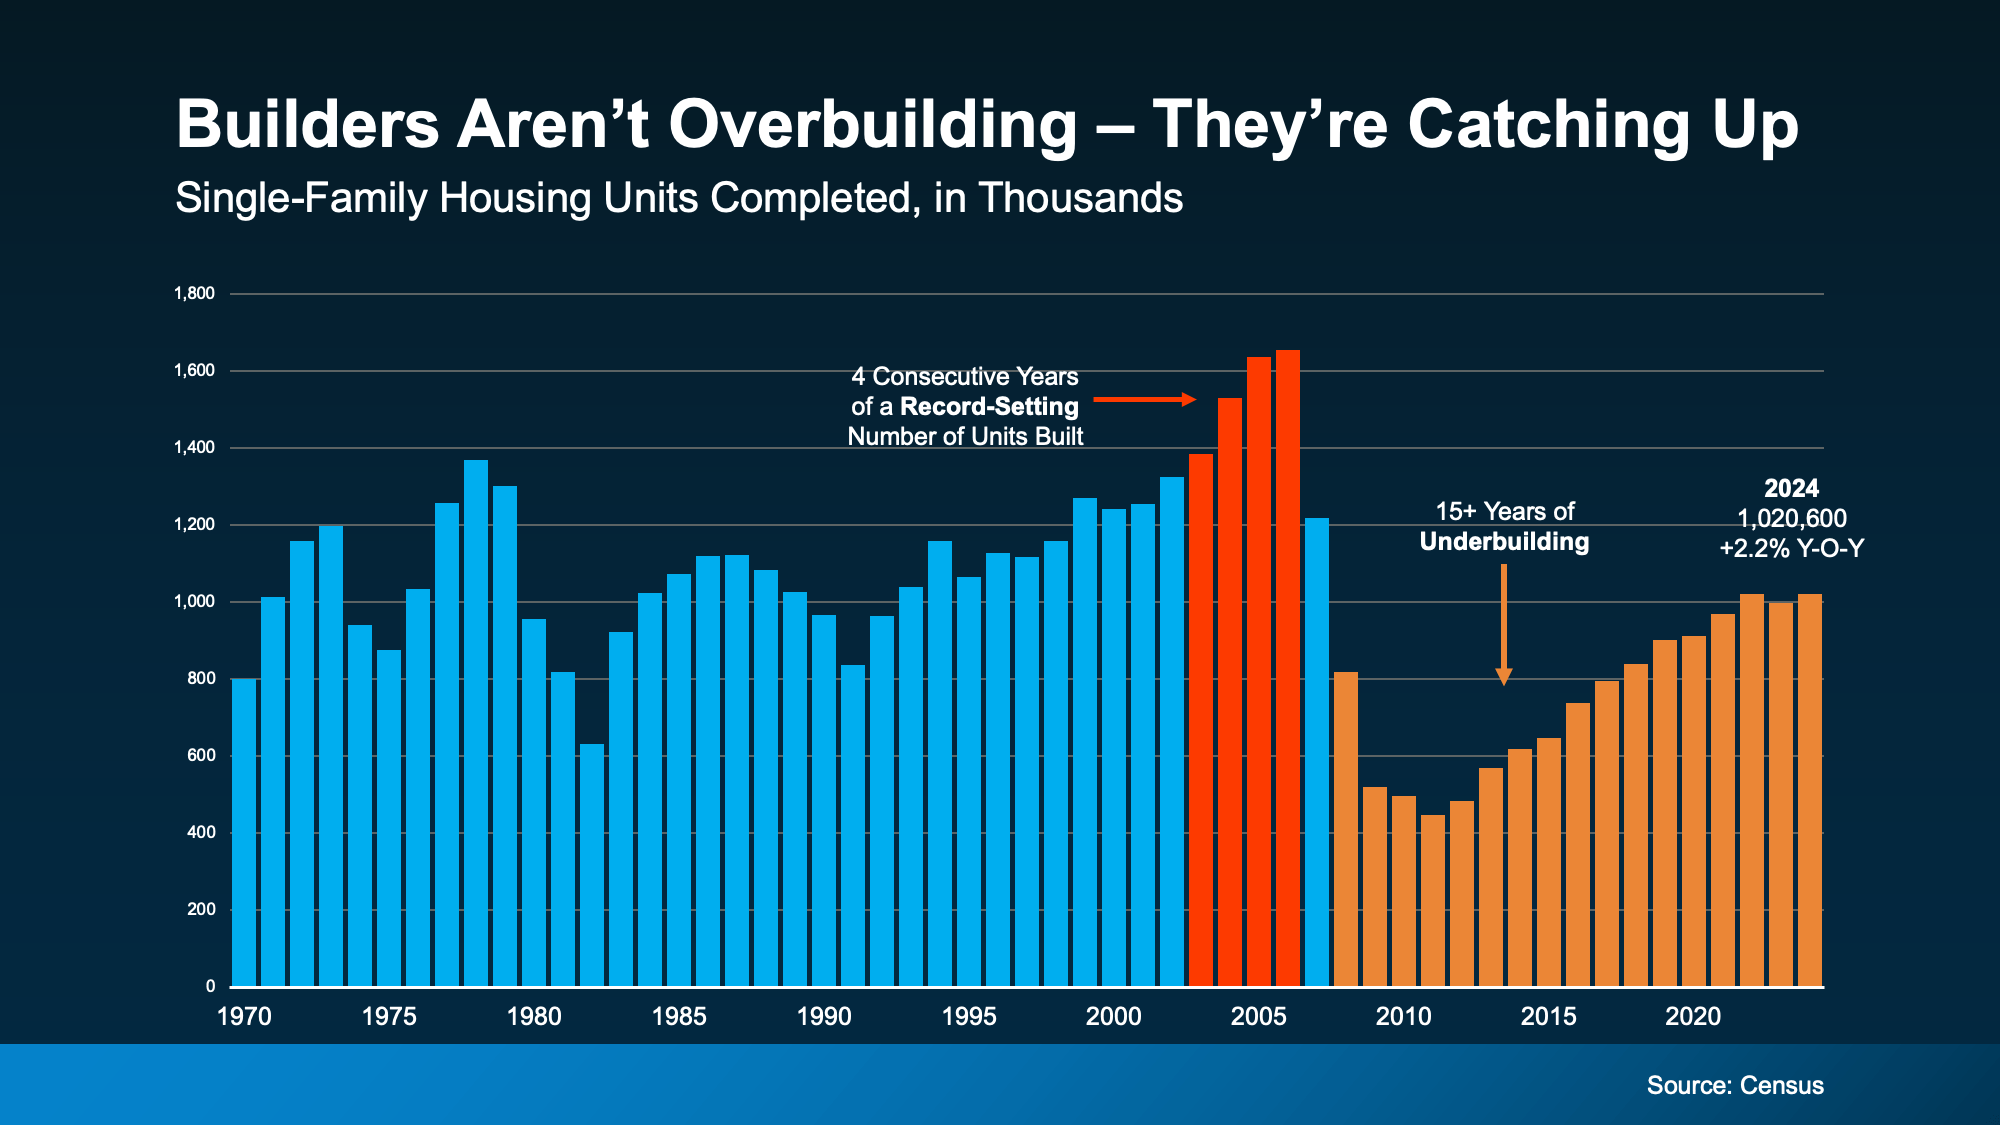
The graph below uses Censusdata to show the overbuilding leading up to the crash (in red), and the period of underbuilding that followed (in orange):
Basically, we had more than 15 straight years of underbuilding – and we’re only recently starting to slowly climb out of that hole. But there’s still a long way to go (even with the growth we’ve seen lately). Experts at Realtor.comsay it would take roughly 7.5 years to build enough homes to close the gap.
Of course, like anything else in real estate, the level of supply and demand is going to vary by market. Some markets may have more homes for sale, some less. But nationally, this isn’t like the last time.
Bottom Line
Just because there are more new homes for sale right now, it doesn’t mean we’re headed for a crash. The data shows today’s overall inventory situation is different.
If you have questions or want to talk about what builders are doing in our area, let’s connect.
Now that the market is slowing down, homeowners who haven’t sold at the price they were hoping for are increasingly pulling their homes off the market. According to the latest data from Realtor.com, the number of homeowners taking their homes off the market is up 38% since the start of this year and 48% since the same time last June. For every 100 new listings in June, about 21 homes were taken off the market.
And if you’ve made that same choice, you’re probably frustrated things didn’t go the way you wanted. It’s hard when you feel like the market isn’t working with you. But while slowdowns can be painful in the moment, history tells us they don’t last forever.
History Repeats Itself: Proof from the Past
This isn’t the first time the housing market has experienced a slowdown. Here are some other notable times when home sales dropped significantly:
1980s: When mortgage rates climbed past 18%, buyers stopped cold. Sales crawled for years. But as soon as rates came down, sales surged back, and the market found its footing again.
2008: The Great Financial Crisis was one of the toughest housing downturns in history. Sales and prices both dropped hard. Still, sales rebounded once the economy recovered.
2020: During COVID, sales disappeared overnight, and many people had to put their plans on hold. Yet the recovery was faster than anyone expected, with a surge of buyers re-entering the market as soon as restrictions eased.
The lesson is clear: no matter the cause, the market always rebounds.
Today’s Situation: Where We Stand Now
Over the past few years, home sales have been sluggish. And one big reason why is affordability. Mortgage rates rose at a record-breaking pace in 2022, and home prices were climbing at the same time. That combination put buying out of reach for many people. And when demand slows, home sales do too.
The Outlook: Why Things Will Improve
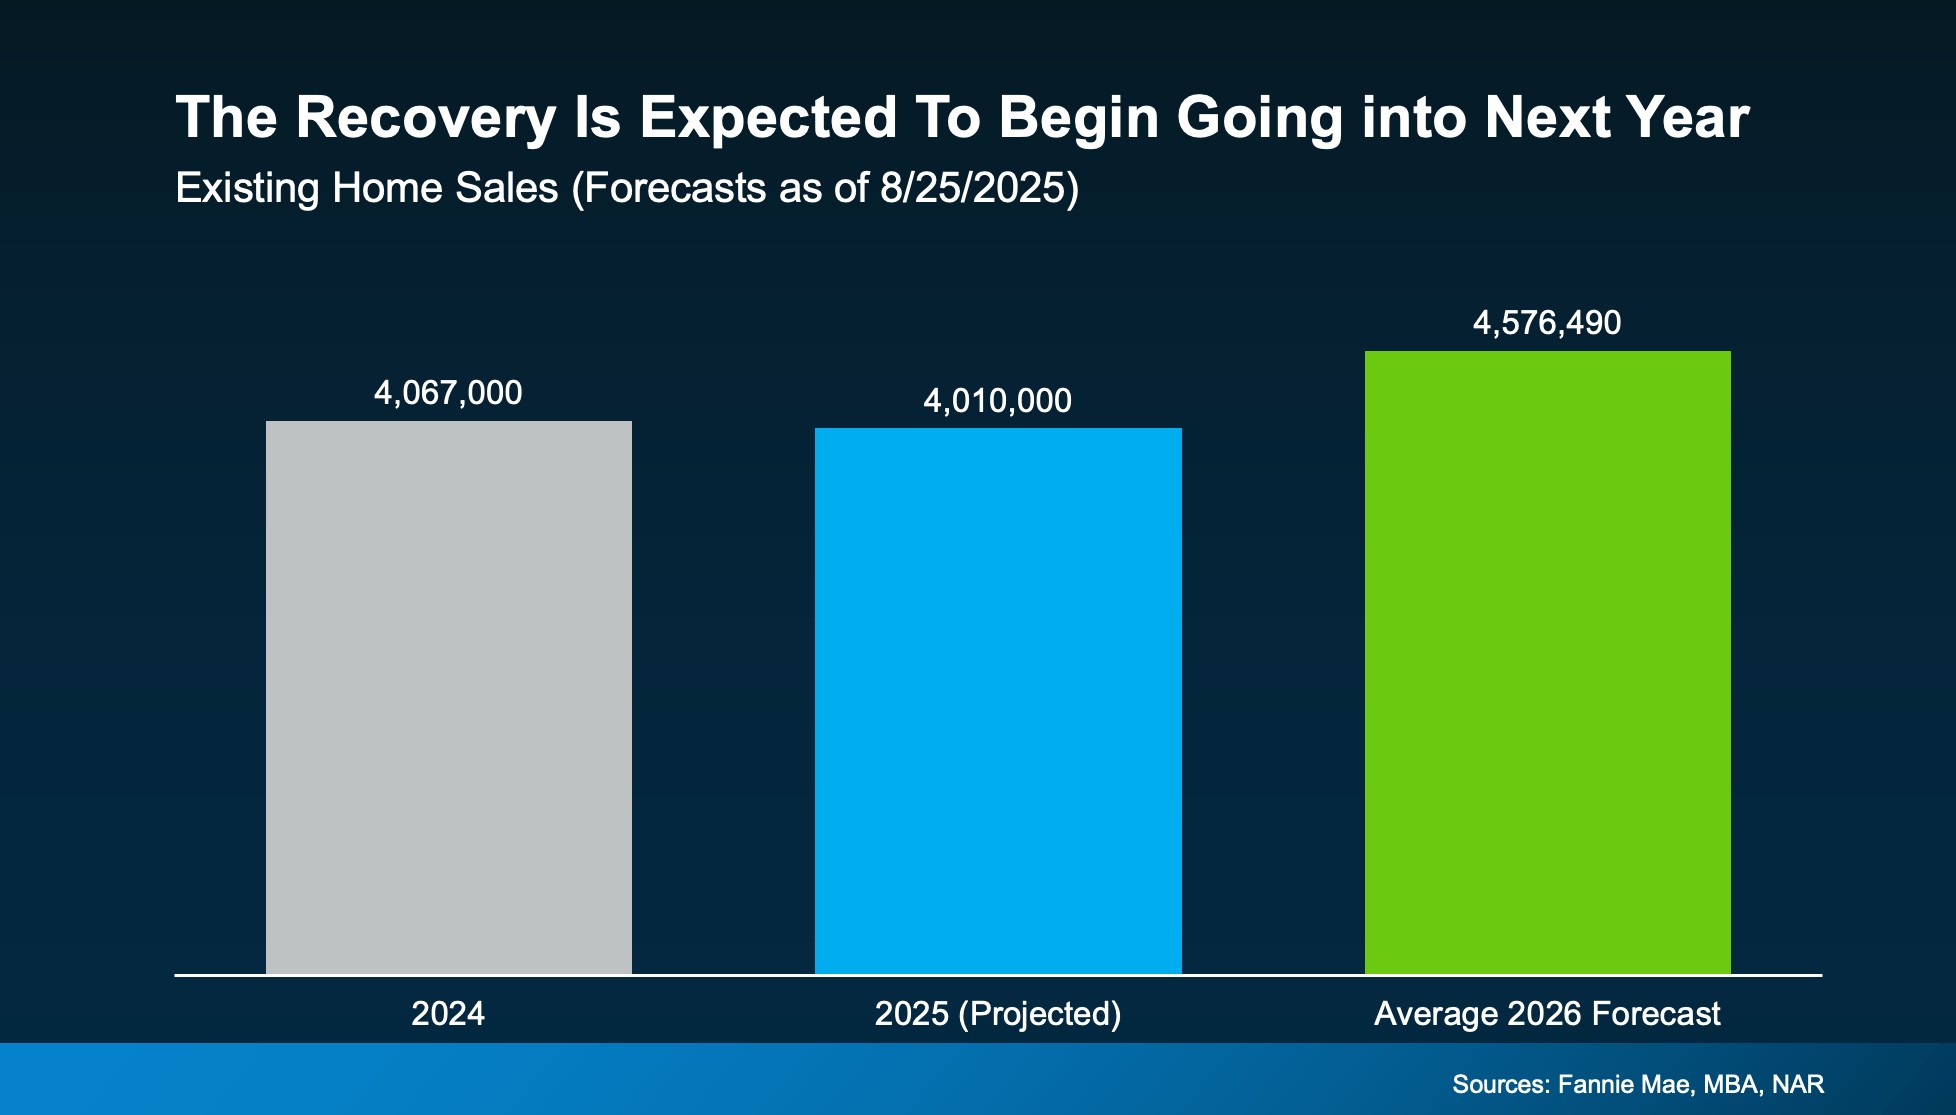
But here’s the encouraging part. Forecasts show sales are expected to pick up again moving into 2026.
Last year, just about 4 million homes sold (shown in gray in the graph below). And this year is looking very similar (shown in blue). But the average of the latest forecasts from Fannie Mae, the Mortgage Bankers Association (MBA), and the National Association of Realtors (NAR) show the experts believe there will be around 4.6 million home sales in 2026 (shown in green).
And a big reason behind that projection is the expectation that mortgage rates will come down a bit, making it easier for more buyers to jump back in.
That means what’s happening now is part of a cycle we’ve seen before. Every slowdown in the past has eventually given way to more activity, and this one will too.
Just like the 1980s, 2008, and 2020, today’s dip in home sales is temporary.
What That Means for You
If you’ve paused your moving plans, you did what you thought was right. Your frustration is valid. But it’s also important to remember the bigger picture. Housing slowdowns don’t last forever.
That’s where your local real estate agent comes in. Their job is to keep a close eye on the market for you. When the first signs of a rebound appear, they’ll help you spot the shift early so you can relist with confidence.
Bottom Line
If today’s housing market feels stuck, remember it’s never stayed down for good. Slowdowns end, activity returns, and people get moving again. So, let’s connect, because when the next wave of buyers shows up, you won’t want to miss it.
As activity picks up again, will you be ready to put your house back on the market, or do you need to move sooner?
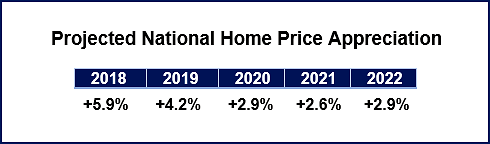
Home price increases in the Puget Sound area have started to moderate. While down from the unsustainable highs of this spring, prices continue to be up compared to a year ago. So, where are home prices headed next?
The Home Price Expectation Survey checks in with over 100 national real estate experts every quarter, including Windermere Chief Economist Matthew Gardner. Here’s where they think prices will go:
Gardner predicts our local market will fare better than the nation overall.
“As I look to 2019, I believe home prices in King County will increase 7.8% over the current year.” – Windermere Chief Economist Matthew Gardner
“The local economy will continue to grow and that will drive demand for ownership housing,” according to Gardner. “Supply will slow during the holiday season before we see a new influx of listings in the spring. With more supply, I believe that home price growth will continue to slow, but values will still increase.”
 Facebook
 X
X
 Pinterest
 Copy Link