Facebook
 X
X
 Pinterest
 Copy Link

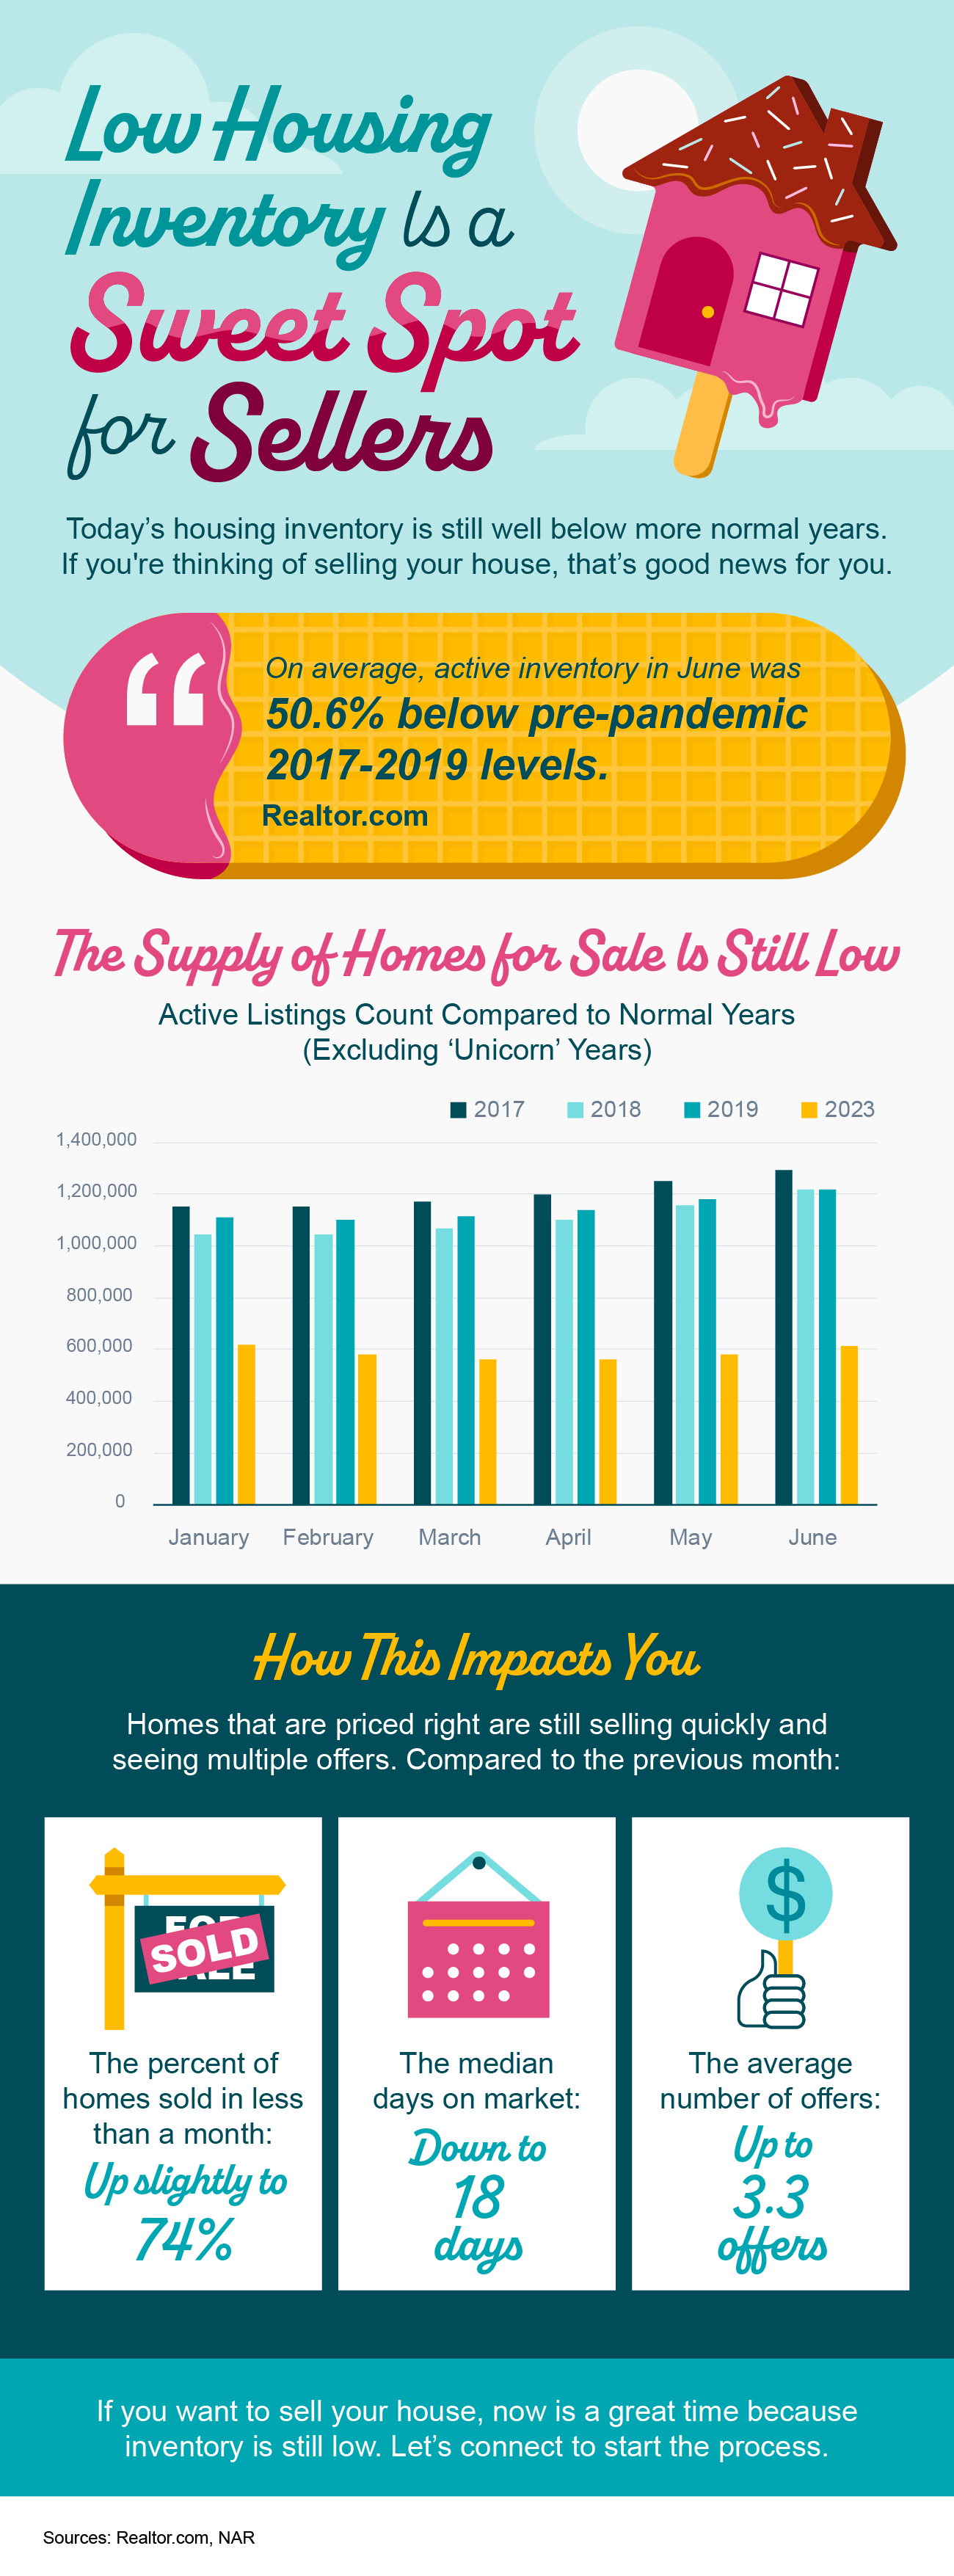
While this isn’t the frenzied market we saw during the ‘unicorn’ years, homes that are priced right are still selling quickly and seeing multiple offers right now. That’s because the number of homes for sale is still so low. Data from the National Association of Realtors (NAR) shows 76% of homes sold within a month and the average saw 3.5 offers in June.
To set yourself up to see advantages like these, you need to rely on an agent. Only an agent has the expertise needed to find the right asking price for your house. Here’s what’s at stake if that price isn’t accurate for today’s market value.
The price you set for your house sends a message to potential buyers.
Price it too low and you might raise questions about your home’s condition or lead buyers to assume something is wrong with it. Not to mention, if you undervalue your house, you could leave money on the table, which decreases your future buying power.
On the other hand, price it too high and you run the risk of deterring buyers from ever touring it in the first place. When that happens, you may have to do a price drop to try to re-ignite interest in your house when it sits on the market for a while. But be aware that a price drop can be seen as a red flag for some buyers who will wonder why the price was reduced and what that means about the home.
A recent article from NerdWallet sums it up like this:
“Your house’s market debut is your first chance to attract a buyer and it’s important to get the pricing right. If your home is overpriced, you run the risk of buyers not seeing the listing . . . But price your house too low and you could end up leaving some serious money on the table. A bargain-basement price could also turn some buyers away, as they may wonder if there are any underlying problems with the house.”
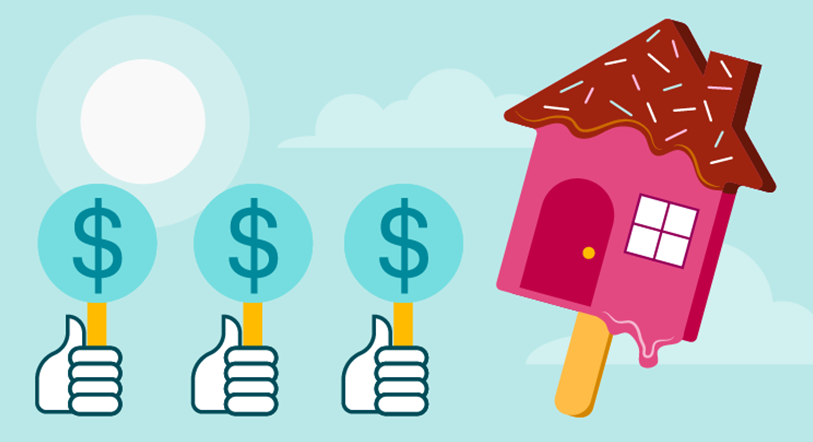
Think of pricing your home as a target. Your goal is to aim directly for the center – not too high, not too low, but right at market value.
Pricing your house fairly based on market conditions increases the chance you’ll have more buyers who are interested in purchasing it. That makes it more likely you’ll see multiple offers too. Plus, when homes are priced right, they still tend to sell quickly.
To get a high-level look into the potential downsides of over or underpricing your house and the perks that come with pricing it at market value, see the chart below:

Lean on a Professional’s Expertise to Price Your House Right
So why is an agent essential in finding the right price? Your local agent has the skill and the insight necessary to find the market value of your home. They’ll use their expertise to determine a realistic listing price by assessing:
- The prices of recently sold homes
- The current market conditions
- The size and condition of your house
- The location of your house
Bottom Line
Pricing your house at market value is critical, so don’t rely on guesswork. Let’s connect to make sure your house is priced right for today’s market.