 Facebook
 X
X
 Pinterest
 Copy Link

The Best Time To Sell Your House Is When Others Aren’t Selling

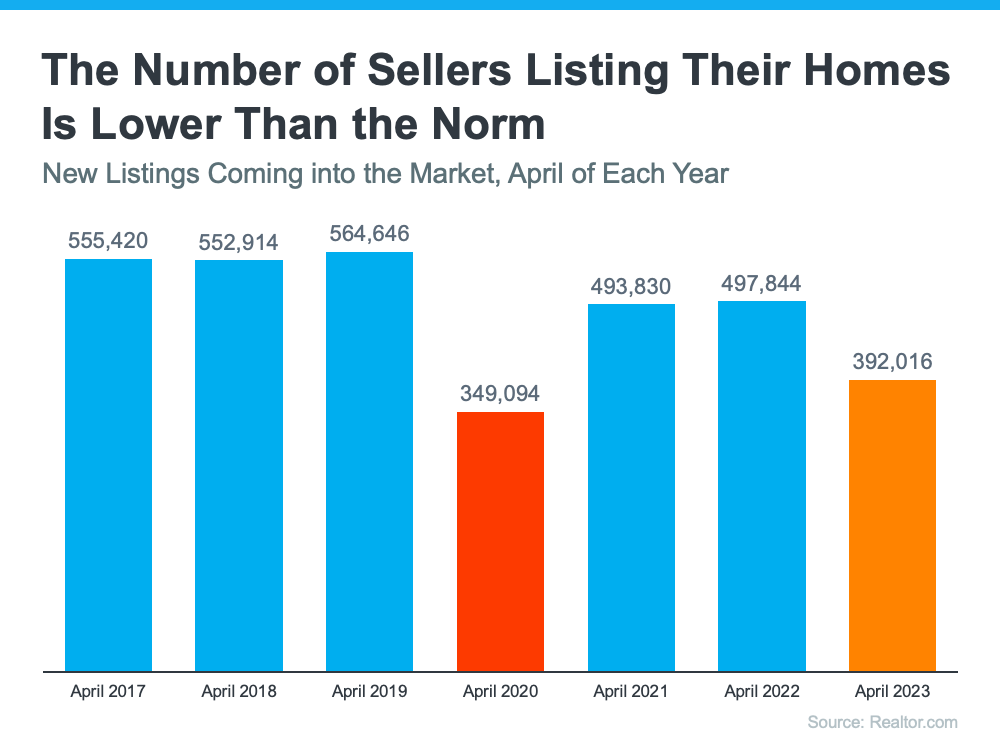
If you’re thinking about selling your house, you should know the number of homes for sale right now is low. That’s because, this season, there are fewer sellers listing their houses for sale than the norm.
Looking back at every April since 2017, the only year when fewer sellers listed their homes was in April 2020, when the pandemic hit and stalled the housing market (shown in red in the graph below). In more typical years, roughly 500,000 sellers add their homes to the market in April. This year, we saw fewer than 400,000 sellers entering the market in April (see graph below):
While there are a number of factors contributing to this trend, one thing keeping inventory low right now is that some homeowners are reluctant to move when the mortgage rate they have on their current house is lower than the one they could get today on their next house. It’s called rate lock.
As a recent survey from Realtor.com explains, 56% of people who are planning to sell in the next 12 months say they’re waiting for rates to come down.
While this wait-and-see approach is right for some sellers, it also creates an opening for more eager sellers to jump in now.
If your current house truly doesn’t fit your needs anymore and you’re ready to move, don’t miss this chance to stand out. When fewer sellers are putting their homes up for sale, buyers will have fewer options, so you set yourself up to get the most eyes possible on your house. That’s why your house could see multiple offers as buyers compete over the limited supply of homes for sale – especially if you price it right.
As Lawrence Yun, Chief Economist at the National Association of Realtors (NAR), says:
“Inventory levels are still at historic lows . . . Consequently, multiple offers are returning on a good number of properties.”
Bottom Line
If you’re ready to sell now, beat the competition before it comes onto the market. If you do, your house should stand out and could get multiple offers. Let’s connect to get you market ready.
Eastside Stats – May 2023
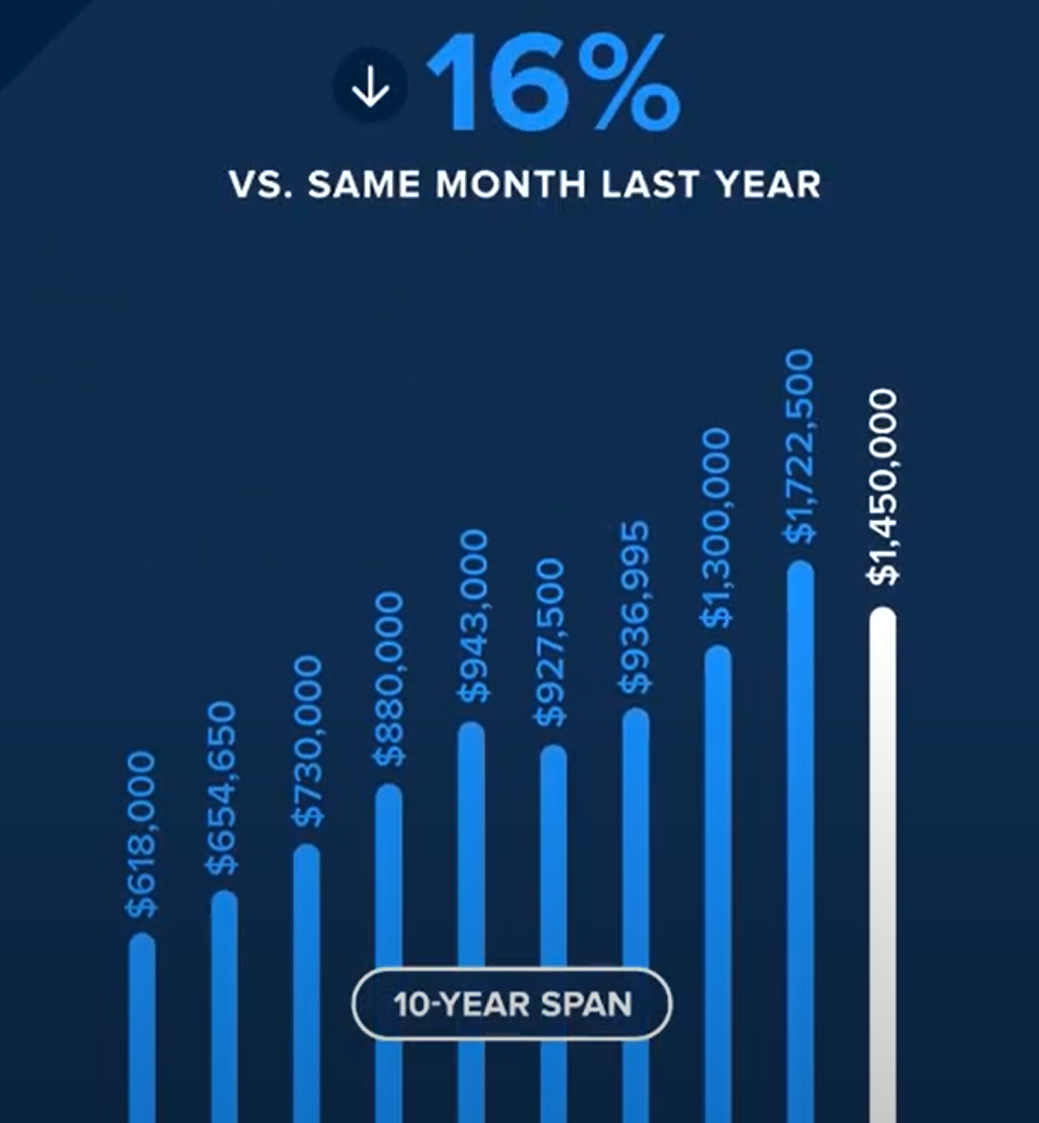
Pricing has been a roller coaster, to say the least. The Eastside is down 16% year-over-year, but up 10% since January. Before prices started to drop/correct they rose a whopping, clearly unsustainable, 31% in 7 months, from September 2021 to April 2022. Then, from April 2022 to August 2022, prices dropped/corrected 22% over four months as interest rates rapidly rose. Whew, that was quite a ride! Inventory continues to be low. Homes priced right and in good condition are selling with multiple offers a median of 5% over the asking price. If the house stays on the market for more than 2 weeks, it is selling at 3% under asking. That is an 8% swing! The CPI data dipped to 4.9%, which is supposed to be promising news for interest rates. Time will tell.
Buyer Activity Is Up Despite Higher Mortgage Rates

If you’re a homeowner thinking about making a move, you may wonder if it’s still a good time to sell your house. Here’s the good news. Even with higher mortgage rates, buyer traffic is actually picking up speed.
Data from the latest ShowingTime Showing Index, which is a measure of buyers actively touring homes, helps paint the picture of how much buyer demand has increased in recent months (see graph below):
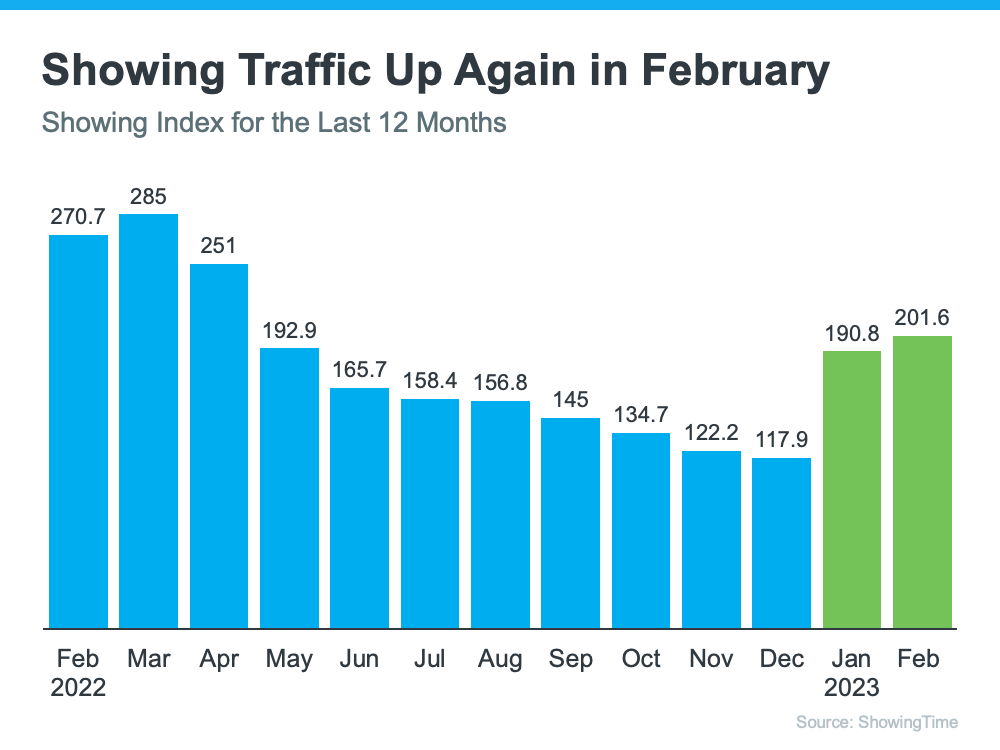
As the graph shows, the first two months of 2023 saw a noticeable increase in buyer traffic. That’s likely because the limited number of homes for sale kept shoppers looking for homes even during colder months.
To help tell the story of why the latest report is significant, let’s compare foot traffic this February with each February for the last six years (see graph below). It shows this was one of the best Februarys for buyer activity we’ve seen in recent memory.
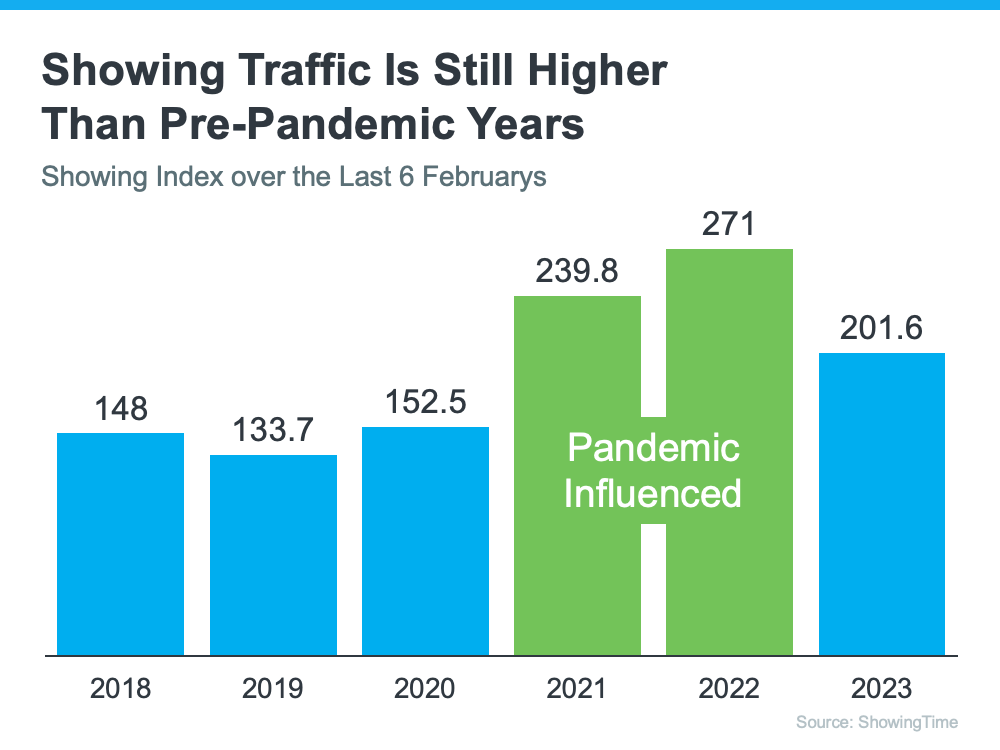
In the last six years, we saw the most February buyer traffic in 2021 and 2022 (shown in green above), but those years were highly unusual for the housing market. So, if we compare February 2023 with the more normal, pre-pandemic years, data shows this year still marks a clear rise in buyer activity.
The uptick in buyer traffic is even more noteworthy considering the increase in mortgage rates this February. The Freddie Mac 30-year fixed mortgage rate rose from 6.09% during the week of February 2nd to 6.50% in the week of February 23rd. But even with higher rates, more buyers were looking for a home.
Jeff Tucker, Senior Economist at Zillow, says the increased buyer activity could continue:
“More buyers will keep coming out of the woodwork. We always see a seasonal uptick in home shoppers in March and April . . .”
If you’re looking to sell your house, seeing buyers still active in the market this year should be encouraging. It’s a sign buyers are out there and could be looking for a home just like yours. Working with a real estate professional to list your house now will help you get your home in front of eager buyers today.
Bottom Line
Rising foot traffic is a bright spot for this year’s housing market and indicates that buyers are looking to purchase this year, even with higher mortgage rates. If you’re ready to sell your house, let’s connect.
A Recession Doesn’t Equal a Housing Crisis

 Everywhere you look, people are talking about a potential recession. And if you’re planning to buy or sell a house, this may leave you wondering if your plans are still a wise move. To help ease your mind, experts are saying that if we do officially enter a recession, it’ll be mild and short. As the Federal Reserve explained in their March meeting:
“. . . the staff’s projection at the time of the March meeting included a mild recession starting later this year, with a recovery over the subsequent two years.”
While a recession may be on the horizon, it won’t be one for the housing market record books like the crash in 2008. What we have to remember is that a recession doesn’t always lead to a housing crisis.
To prove it, let’s look at the historical data of what happened in real estate during previous recessions. That way you know why you shouldn’t be afraid of what a recession could mean for the housing market today.
A Recession Doesn’t Mean Falling Home Prices
To show that home prices don’t fall every time there’s a recession, it helps to turn to historical data. As the graph below illustrates, looking at recessions going all the way back to 1980, home prices appreciated in four of the last six of them. So historically, when the economy slows down, it doesn’t mean home values will always fall.
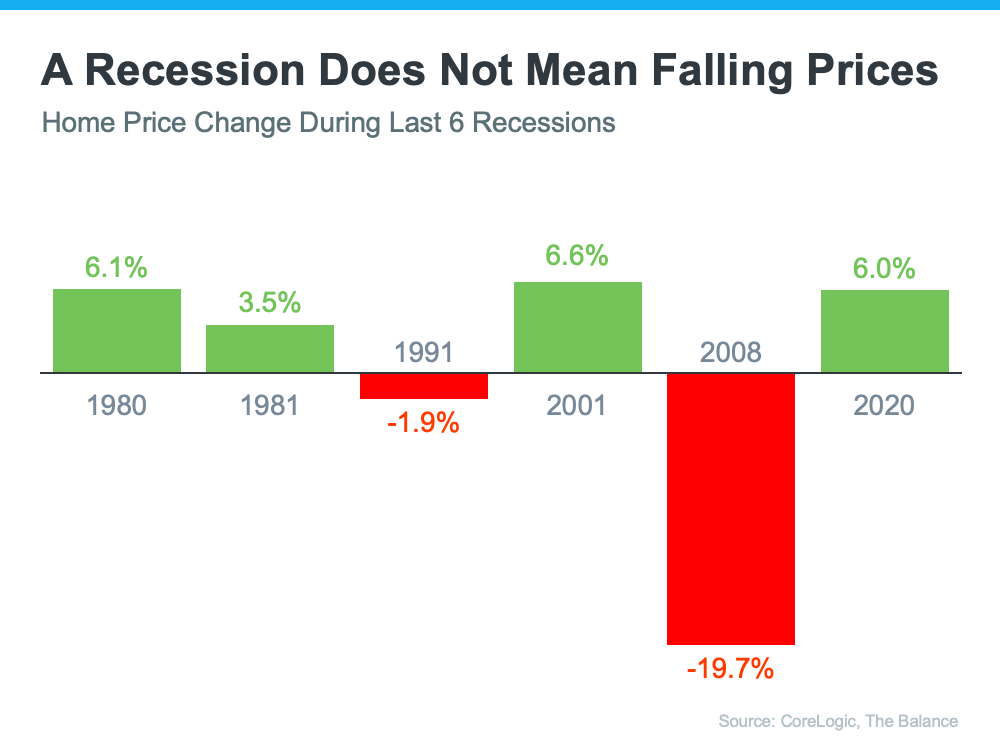
Most people remember the housing crisis in 2008 (the larger of the two red bars in the graph above) and think another recession will be a repeat of what happened to housing then. But today’s housing market isn’t about to crash because the fundamentals of the market are different than they were in 2008. Back then, one of the big reasons why prices fell was because there was a surplus of homes for sale at the same time distressed properties flooded the market. Today, the number of homes for sale is low, so while home prices may see slight declines in some areas and slight gains in others, a crash simply isn’t in the cards.
A Recession Means Falling Mortgage Rates
What a recession really means for the housing market is falling mortgage rates. As the graph below shows, historically, each time the economy slowed down, mortgage rates decreased.
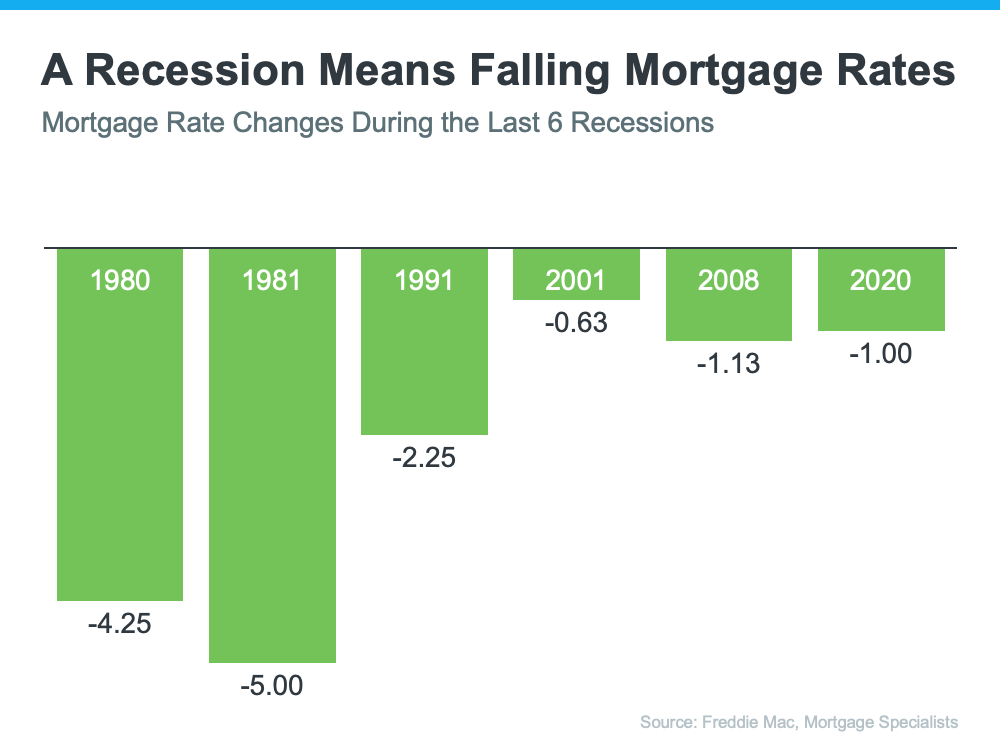
Bankrate explains mortgage rates typically fall during an economic slowdown:
“During a traditional recession, the Fed will usually lower interest rates. This creates an incentive for people to spend money and stimulate the economy. It also typically leads to more affordable mortgage rates, which leads to more opportunity for homebuyers.”
This year, mortgage rates have been quite volatile as they’ve responded to high inflation. The 30-year fixed mortgage rate has hovered between roughly 6-7%, and that’s impacted affordability for many potential homebuyers.
But, if there is a recession, history tells us mortgage rates may fall below that threshold, even though the days of 3% are behind us.
Bottom Line
You don’t need to fear what a recession means for the housing market. If we do have a recession, experts say it will be mild and short, and history shows it also means mortgage rates go down.
What Are the Experts Saying About the Spring Housing Market?

The housing market’s been going through a lot of change lately, and there’s been uncertainty surrounding what will happen this spring. You may be wondering if more homes will go on the market, what’s next with home prices and mortgage rates, or what the best advice is for someone in your position right now.
Here’s what industry experts are saying right now about the spring housing market and what it means for you:
Selma Hepp, Chief Economist, CoreLogic:
“We see more competition among buyers . . . Housing supply also tends to grow during the spring months. And this is also the time of year when relatively more migration happens, as people graduate and move elsewhere looking for jobs.”
Greg McBride, Chief Financial Analyst, Bankrate:
“I don’t expect big moves in prices in the span of a month, but like the flower buds of spring, the housing market is showing signs of improvement. A pick up in activity with inventory still low does bode well for home prices.”
Rick Sharga, Founder and CEO, CJ Patrick Company:
“If you can find a home you love and can afford at today’s prices, don’t wait. Home prices in most of the country are unlikely to crash, and mortgage rates will only come down very gradually if they decline at all this year.”
Jeff Tucker, Senior Economist, Zillow:
“The market is still much friendlier this spring for buyers who can overcome affordability hurdles, but buyers are going to see more competition than they might expect because there are not many homes on the market to go around. New listings are increasing, which they almost always do this time of year, but not nearly as quickly as usual.”
Bottom Line
If you’re thinking about selling your house, this spring’s a great time to do so while inventory is still so low. And if you’re in a good position to buy, lean on your team of expert advisors for the best advice. Whatever your plans, let’s connect to make sure you’re able to navigate the spring housing market with confidence.
