If you’re thinking of selling your house, it’s important to work with someone who understands how the market is changing and what it means for you. Here are five reasons working with a professional can ensure you’ll get the most out of your sale.
1. They’re Experts on Market Trends
With today’s housing market defined by change, it’s critical to work with someone who knows the latest information and how it impacts your goals. An expert real estate advisor knows about national trends and your local area too. More importantly, they’ll give insight to what all of this means for you, so they’ll be able to help you make a decision based on trustworthy, data-bound information.
2. A Local Professional Knows How To Set the Right Price for Your Home
Home price appreciation has moderated this year. If you sell your house on your own, you may be more likely to overshoot your asking price because you’re not as aware of where prices are today. Pricing your house too high can deter buyers or cause your house to sit on the market for longer.
Real estate professionals look at a variety of factors, like the condition of your home and any upgrades you’ve made, with an unbiased eye. They compare your house to recently sold homes in your area to find the best price for today’s market so your house sells quickly.
3. A Real Estate Advisor Helps Maximize Your Pool of Buyers
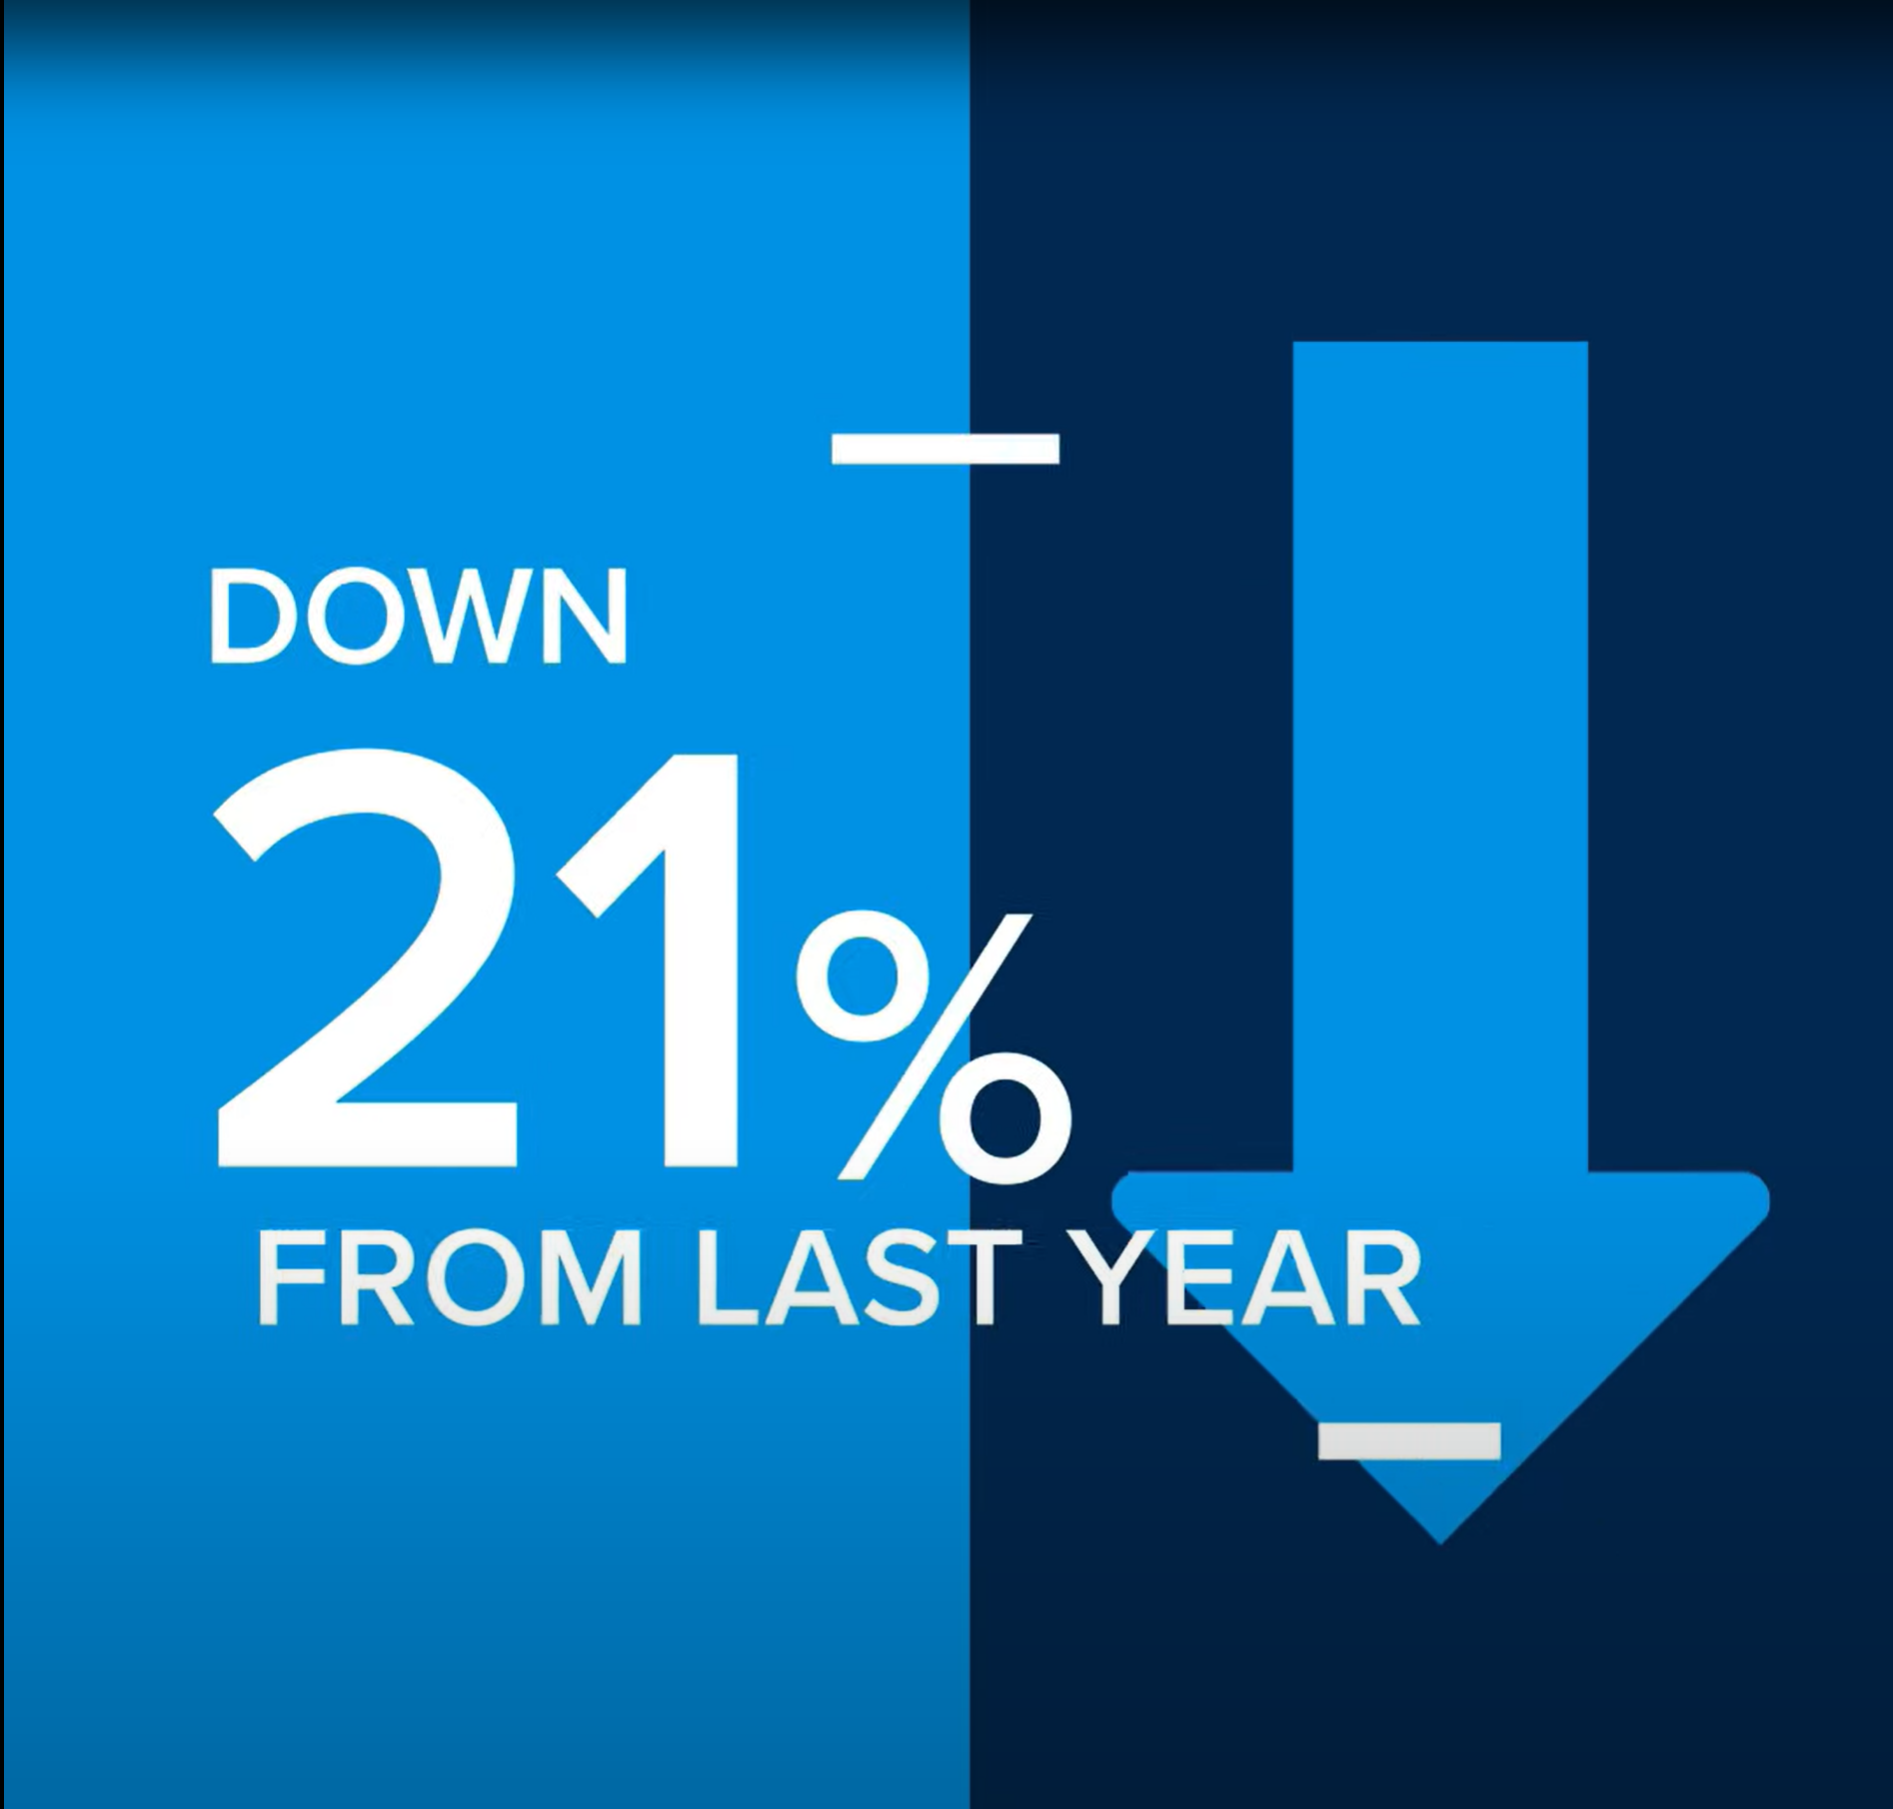
Since buyer demand has cooled this year, you’ll want to do what you can to help bring in more buyers. Real estate professionals have a wide range of tools at their disposal, such as social media followers, agency resources, and the Multiple Listing Service (MLS), to ensure your house gets in front of people looking to make a purchase. Investopedia explains why it’s risky to sell on your own without the network an agent provides:
“You don’t have relationships with clients, other agents, or a real estate agency to bring the largest pool of potential buyers to your home.”
Without access to your agent’s tools and marketing expertise, your buyer pool – and your home’s selling potential – is limited.
4. A Real Estate Expert Will Read – and Understand – the Fine Print
Today, more disclosures and regulations are mandatory when selling a house. That means the number of legal documents you’ll need to juggle is growing. The National Association of Realtors (NAR) puts it like this:
“There’s a lot of jargon involved in a real estate transaction; you want to work with a professional who can speak the language.”
5. A Local Professional Is a Skilled Negotiator
In today’s market, buyers are regaining some negotiation power. If you sell without an expert, you’ll be responsible for any back-and-forth. That means you’ll have to coordinate with:
- The buyer, who wants the best deal possible
- The buyer’s agent, who will use their expertise to advocate for the buyer
- The inspection company, which works for the buyer and will almost always find concerns with the house
- The appraiser, who assesses the property’s value to protect the lender
Instead of going toe-to-toe with these parties alone, lean on an expert. They’ll know what levers to pull, how to address everyone’s concerns, and when you may want to get a second opinion.
Bottom Line
Don’t go at it alone. If you’re planning to sell your house this spring, let’s connect so you have an expert by your side to guide you in today’s market.
 Facebook
 X
X
 Pinterest
 Copy Link


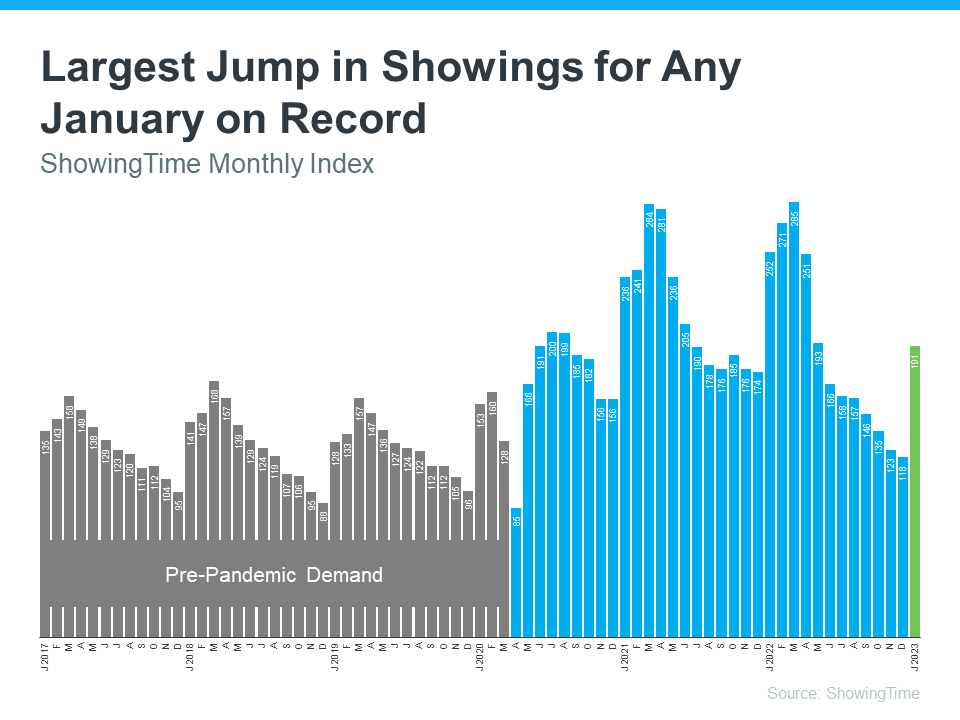
 Though the housing market is no longer experiencing the frenzy of a year ago, buyers are showing their interest in purchasing a home. According to