The Two Big Issues the Housing Market’s Facing Right Now
The biggest challenge the housing market’s facing is how few homes there are for sale. Mark Fleming, Chief Economist at First American, explains the root causes of today’s low supply:
“Two dynamics are keeping existing-home inventory historically low – rate-locked existing homeownersandthe fear of not finding something to buy.”
Let’s break down these two big issues in today’s housing market.
Rate-Locked Homeowners
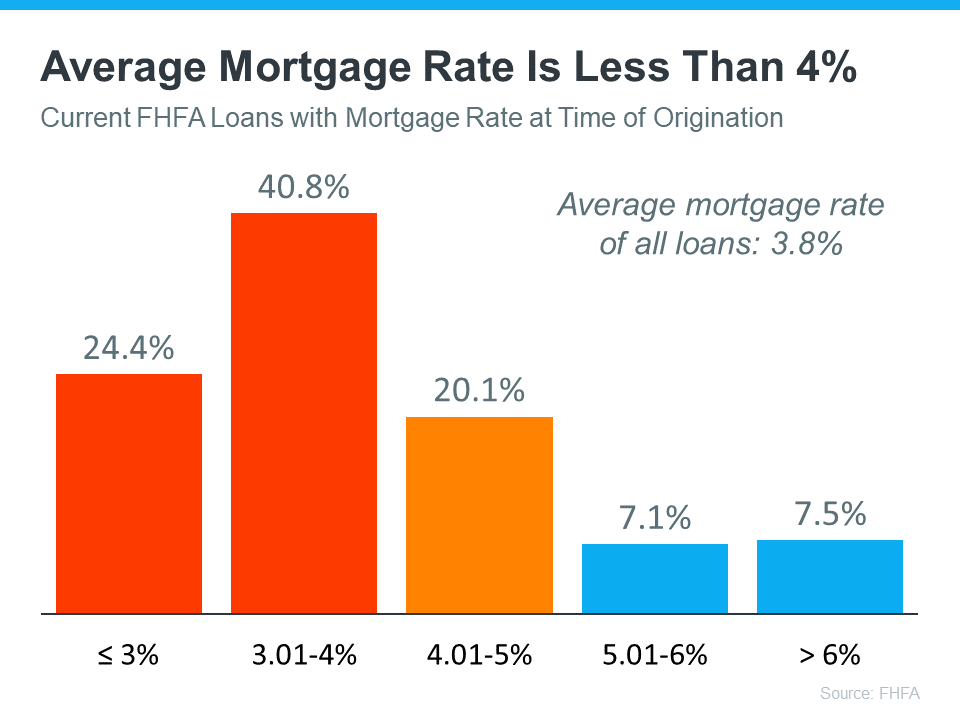
According to the Federal Housing Finance Agency (FHFA), the average interest rate for current homeowners with mortgages is less than 4% (see graph below):
But today, the typical mortgage rate offered to buyers is over 6%. As a result, many homeowners are opting to stay put instead of moving to another home with a higher borrowing cost. This is a situation known as being rate locked.
When so many homeowners are rate locked and reluctant to sell, it’s a challenge for a housing market that needs more inventory. However, experts project mortgage rates will gradually fall this year, and that could mean more people will be willing to move as that happens.
The Fear of Not Finding Something To Buy
The other factor holding back potential sellers is the fear of not finding another home to buy if they move. Worrying about where they’ll go has left many on the sidelines as they wait for more homes to come to the market. That’s why, if you’re on the fence about selling, it’s important to consider all your options. That includes newly built homes, especially right now when builders are offering concessions like mortgage rate buydowns.
What Does This Mean for You?
These two issues are keeping the supply of homes for sale lower than pre-pandemic levels. But if you want to sell your house, today’s market is a sweet spot that can work to your advantage.
Be sure to work with a local real estate professional to explore the options you have right now, which could include leveraging your current home equity. According to ATTOM:
“. . . 48 percent of mortgaged residential properties in the United States were considered equity-rich in the fourth quarter, meaning that the combined estimated amount of loan balances secured by those properties was no more than 50 percent of their estimated market values.”
This could make a major difference when you move. Work with a local real estate expert to learn how putting your equity to work can keep the cost of your next home down.
Bottom Line
Rate-locked homeowners and the fear of not finding something to buy are keeping housing inventory low across the country. But as mortgage rates start to come down this year and homeowners explore all their options, we should expect more homes to come to the market.
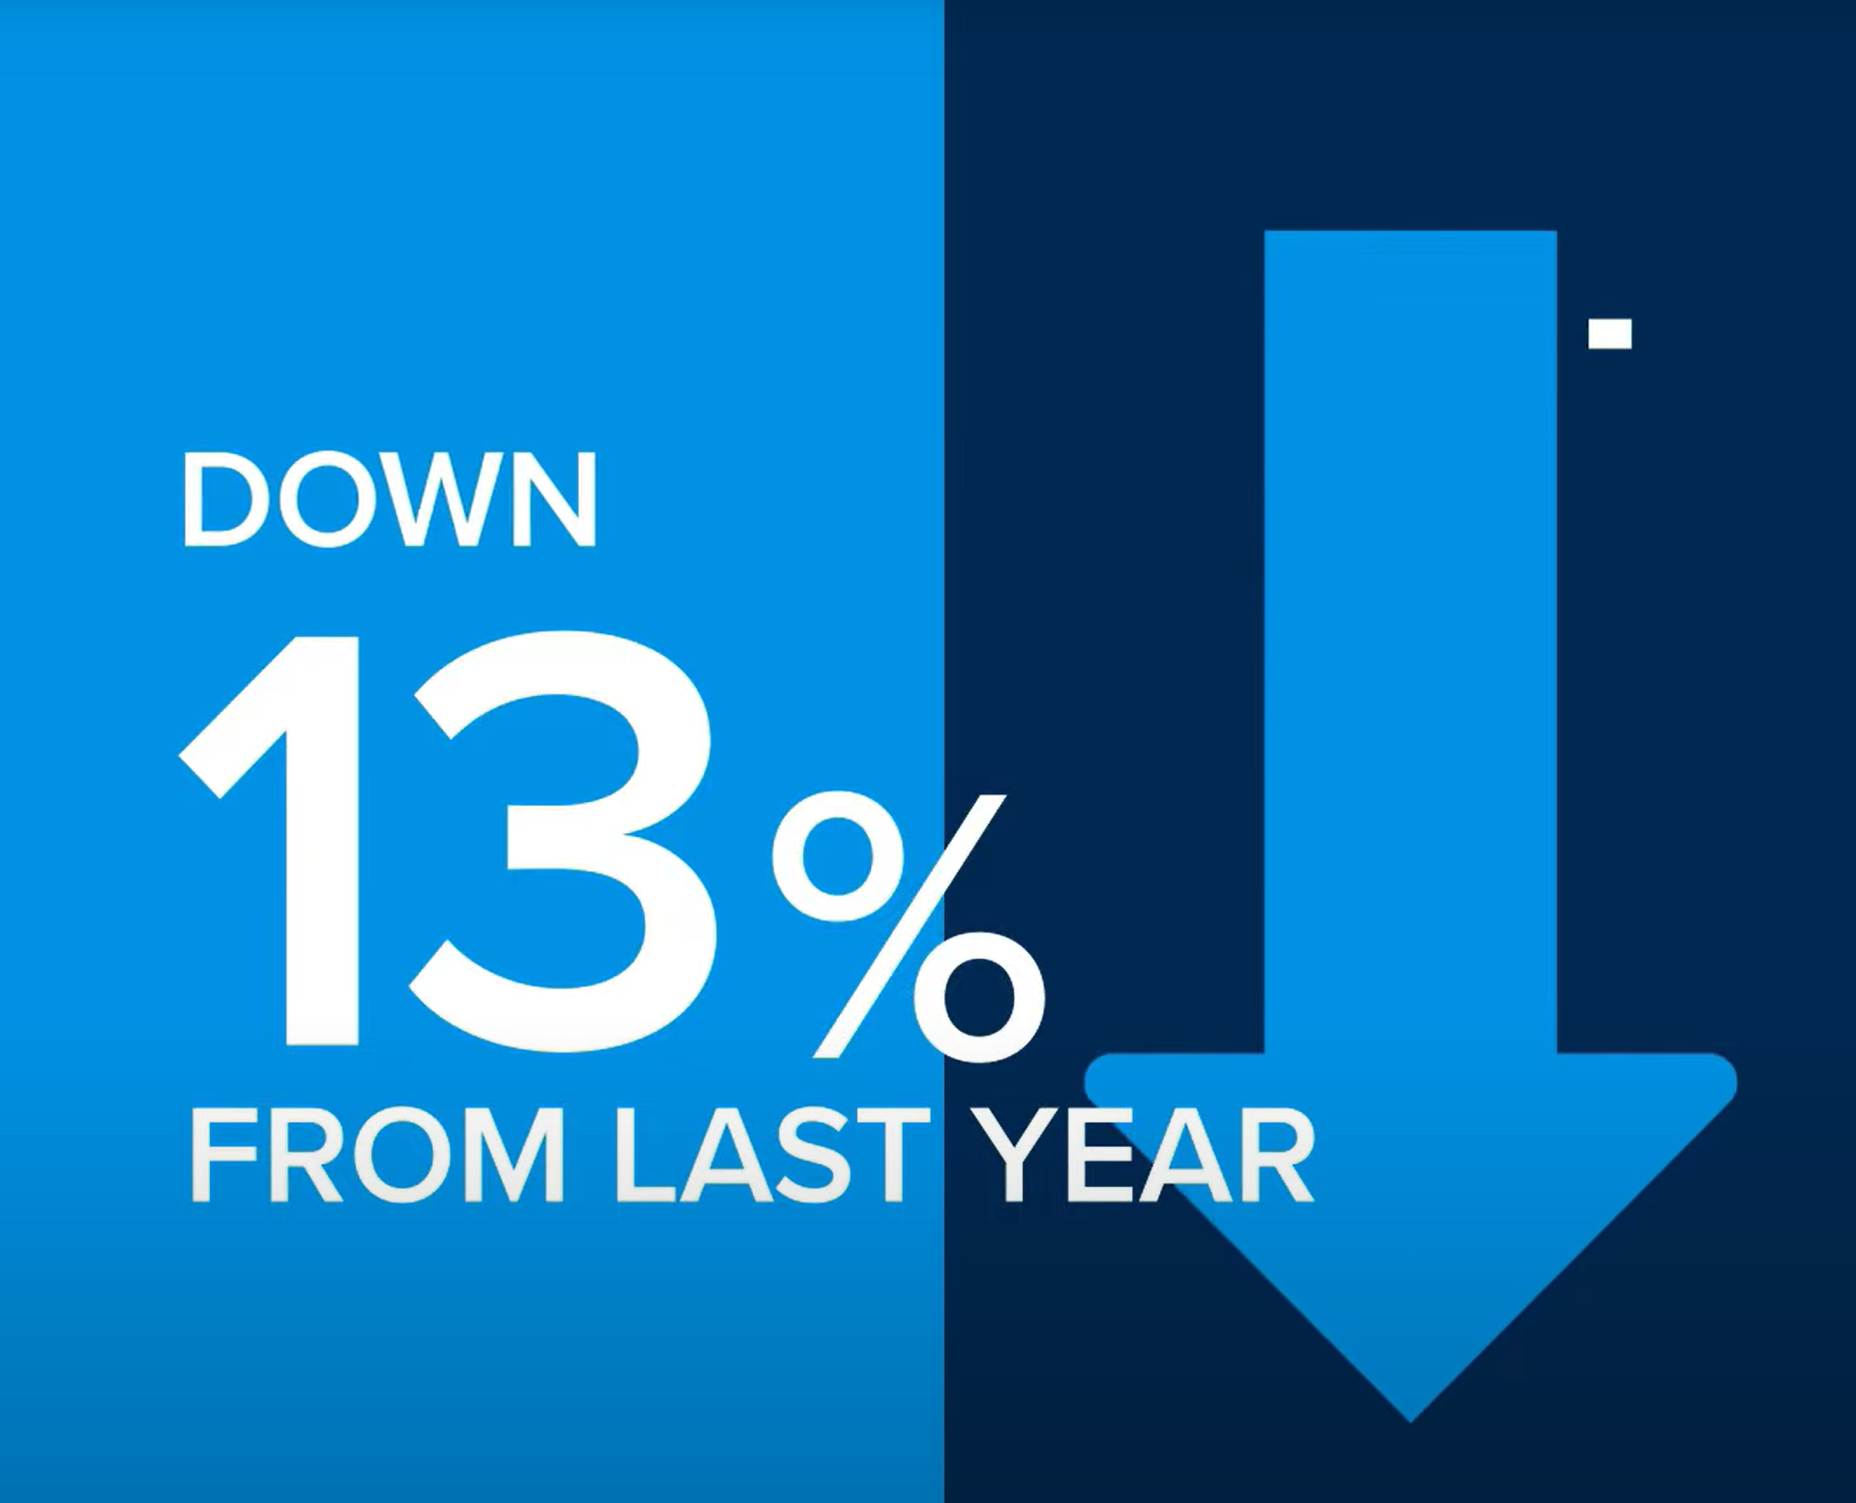
Median pricing crept-up 2% since last month but is down 13% year-over-year. (Note, year-over-year deprecation will continue through June or July.) Interestingly, King County’s year-over-year pricing is flat and Seattle is up 2%, (but, they both will have depreciation next month). Making an analogy, the Eastside was an intense roller coaster like California Screaming/Incredicoaster; whereas, King County and Seattle were a kiddie coaster, like Goofy’s Sky School. Looking bigger picture at Eastside year-over-year pricing, we had 32% (!!) appreciation in 2022 and 22% (!) appreciation in 2021, which lands us 48% higher than January 2020 pricing—not too shabby. Those who bought around the peak should rest assured that they secured the lowest interest rates in history and their monthly payment is lower than if they bought at today’s pricing (and hopefully they can hold on to the home for a several years as pricing will rise). Lastly, at 1.4 months of inventory, we are solidly in a sellers’ market. We need more inventory, which is usually the case in January, so I’m not panicking (yet). Some say the Super Bowl is the kick-off of the real estate season, but I think it’s after mid-winter break (the week of President’s Day) where we really start to see more inventory. Time will tell.
The housing market has gone through a lot of change recently, and much of that was a result of how quickly mortgage rates rose last year.
Now, as we move through 2023, there are signs things are finally going to turn around. Home price appreciation is slowing from the recent frenzy, mortgage rates are coming down, inflation is easing, and overall market activity is starting to pick up. All of that’s great news for the housing market this year. Here’s what experts are saying.
“. . . it appears a turning point for housing lies ahead. In the coming quarters, single-family home building will rise off of cycle lows as mortgage rates are expected to trend lower and boost housing affordability.”
Bottom Line
If you’re thinking about making a move this year, a turnaround in the housing market could be exactly what you’ve been waiting for. Let’s connect to talk about the latest trends in our area.
If you’ve seen recent headlines about foreclosures surging in the housing market, you’re certainly not alone. There’s no doubt, the stories in the media can be pretty confusing right now. They may even make you think twice about buying a home for fear that prices could crash. The reality is, the data shows a foreclosure crisis is not where the market is headed, and understanding what that really means is mission critical if you want to know the truth about what’s happening today. Here’s a deeper look.
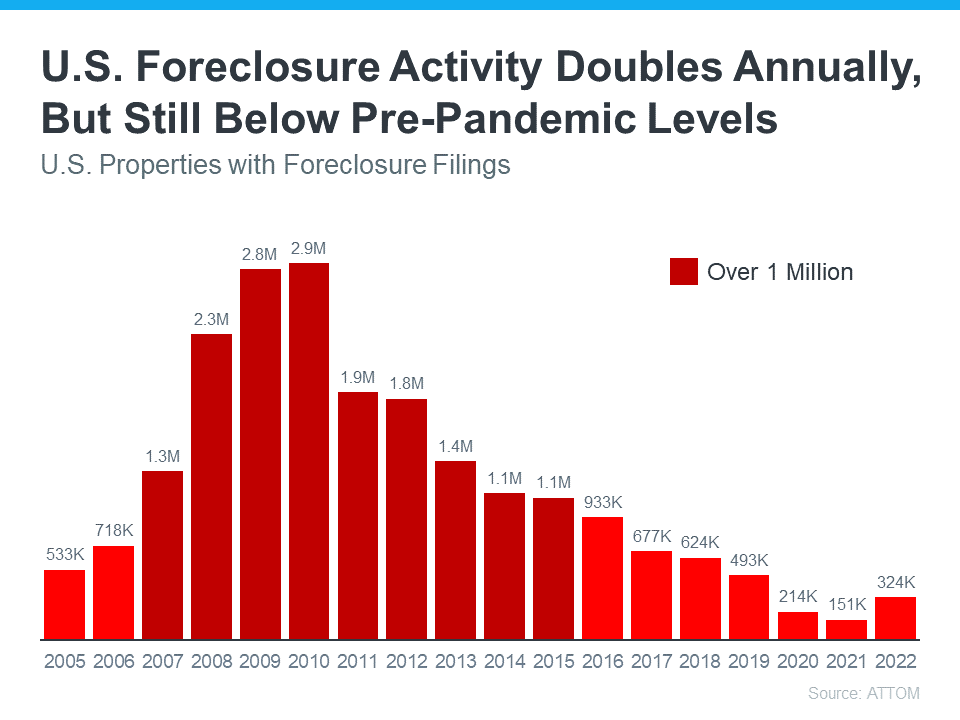
According to the Year-End 2022 U.S. Foreclosure Market Report from ATTOM, foreclosure filings are up 115% from 2021, but down 34% from 2019. As media headlines grab onto this 115% increase, it’s more important than ever to put that percentage into context.
While the number of foreclosure filings did more than double last year, we need to remember why that happened and how it compares to more normal, pre-pandemic years in the market. Thanks to the forbearance program and other relief options for homeowners, foreclosure filings were down to record-low levels in 2020 and 2021, so any increase last year is — no surprise — a jump up. Rick Sharga, Executive VP of Market Intelligence at ATTOM,notes:
“Eighteen months after the end of the government’s foreclosure moratorium, and with less than five percent of the 8.4 million borrowers who entered the CARES Act forbearance program remaining, foreclosure activity remains significantly lower than it was prior to the COVID-19 pandemic. It seems clear that government and mortgage industry efforts during the pandemic, coupled with a strong economy, have helped prevent millions of unnecessary foreclosures.”
Clearly, these options meant millions of homeowners could stay in their homes, allowing them to get back on their feet during a very challenging period. With home values rising at the same time, many homeowners who may have found themselves facing foreclosure under other circumstances were able to leverage their equity and sell their houses rather than face foreclosure, and that trend continues today.
And remember, as the graph below shows, foreclosures today are far below the record-high 2.9 million that were reported in 2010 when the housing market crashed.
So, while foreclosures are rising, keeping perspective in mind is key. As Bill McBride, Founder and Author of Calculated Risk, noted just last week:
“The bottom line is there will be an increase in foreclosures over the next year (from record low levels), but there will not be a huge wave of distressed sales as happened following the housing bubble. The distressed sales during the housing bust led to cascading price declines, and that will not happen this time.”
Bottom Line
Right now, putting the data into context is more important than ever. While the housing market is experiencing an expected rise in foreclosures, it’s nowhere near the crisis levels seen when the housing bubble burst, and that won’t lead to a crash in home prices.
 Facebook
 X
X
 Pinterest
 Copy Link