With higher mortgage rates and moderating buyer demand, conditions in the housing market are different today. And if you’re thinking of selling your house, it’s important to understand how the market has changed and what that means for you. The best way to make sure you’re in the know is to work with a trusted housing market expert.
Here are five reasons working with a professional can ensure you’ll get the most out of your sale.
1. A Real Estate Advisor Is an Expert on Market Trends
Leslie Rouda Smith, 2022 President of the National Association of Realtors (NAR), explains:
“During challenging and changing market conditions, one thing that’s calming and constant is the assurance that comes from a Realtor® being in your corner through every step of the home transaction. Consumers can rely on Realtors®’ unmatched work ethic, trusted guidance and objectivity to help manage the complexities associated with the home buying and selling process.”
An expert real estate advisor has the latest information about national trends and your local area too. More importantly, they’ll know what all of this means for you so they’ll be able to help you make a decision based on trustworthy, data-bound information.
2. A Local Professional Knows How To Set the Right Price for Your House
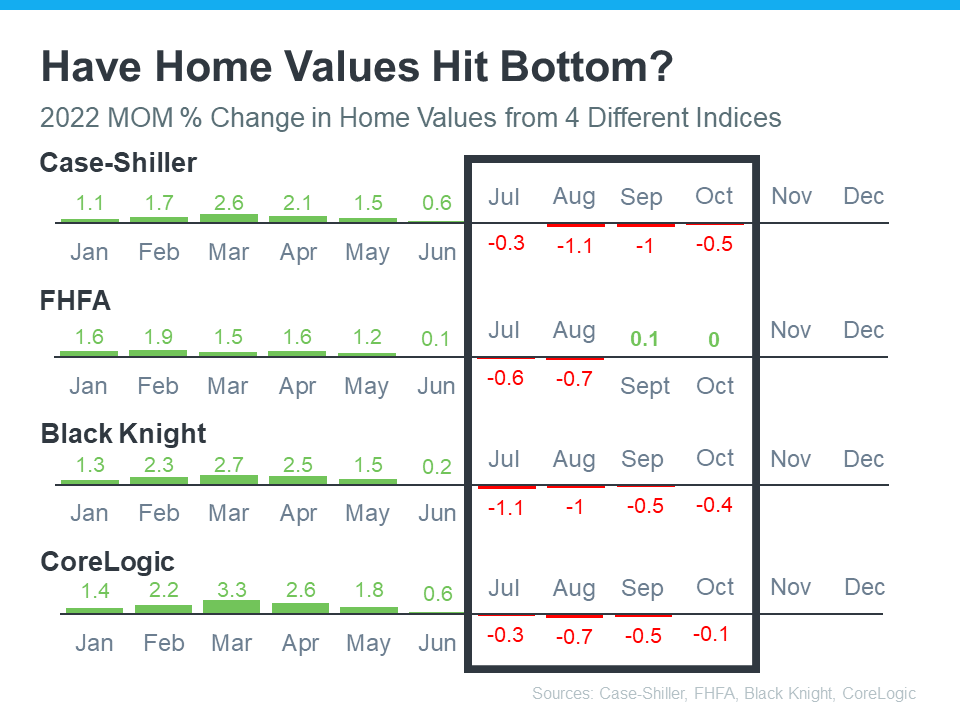
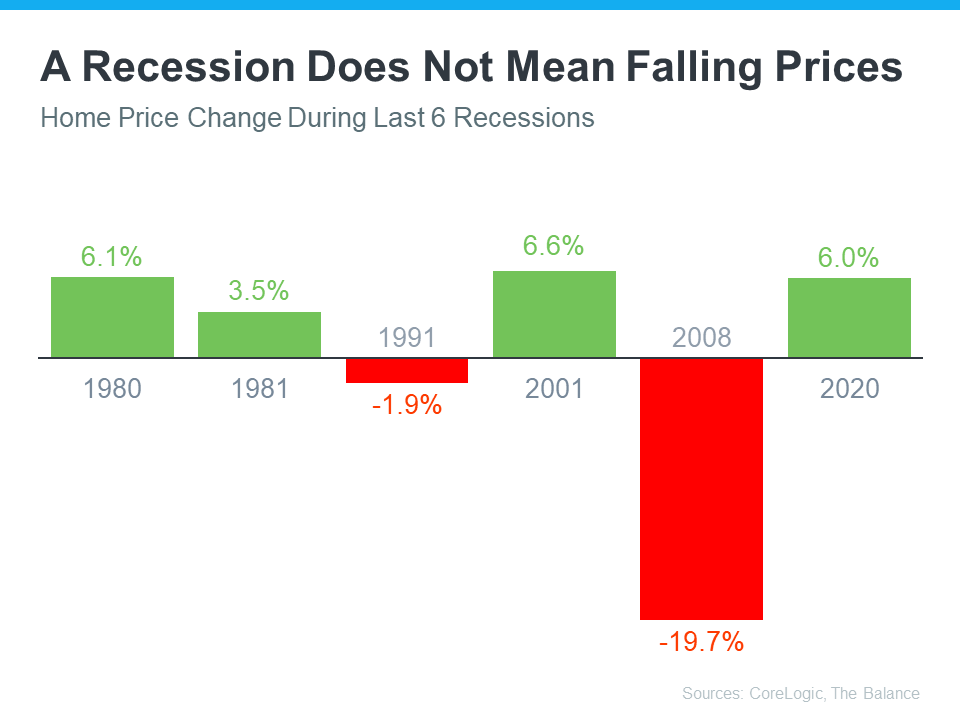
Home price appreciation has moderated this year. If you sell your house on your own, you may be more likely to overshoot your asking price because you’re not as aware of where prices are today. If you do, you run the risk of deterring buyers or seeing your house sit on the market for longer.
Real estate professionals provide an unbiased eye when they help you determine a price for your house. They’ll use a variety of factors, like the condition of your home and any upgrades you’ve made, and compare your house to recently sold homes in your area to find the best price for today’s market. These steps are key to making sure it’s set to move as quickly as possible.
3. A Real Estate Advisor Helps Maximize Your Pool of Buyers
Since buyer demand has cooled this year, you’ll want to do what you can to help bring in more buyers. Real estate professionals have a large variety of tools at their disposal, such as social media followers, agency resources, and the Multiple Listing Service (MLS) to ensure your house gets in front of people looking to make a purchase. Investopedia explains why it’s risky to sell on your own without the network an agent provides:
“You don’t have relationships with clients, other agents, or a real estate agency to bring the largest pool of potential buyers to your home.”
Without access to the tools and your agent’s marketing expertise, your buyer pool – and your home’s selling potential – is limited.
4. A Real Estate Expert Will Read – and Understand – the Fine Print
Today, more disclosures and regulations are mandatory when selling a house. That means the number of legal documents you’ll need to juggle is growing. NAR explains it like this:
“Selling a home typically requires a variety of forms, reports, disclosures, and other legal and financial documents. . . . Also, there’s a lot of jargon involved in a real estate transaction; you want to work with a professional who can speak the language.”
A real estate professional knows exactly what all the fine print means and how to work through it efficiently. They’ll help you review the documents and avoid any costly missteps that could occur if you try to handle them on your own.
5. A Trusted Advisor Is a Skilled Negotiator
In today’s market, buyers are also regaining some negotiation power as bidding wars ease. If you sell without a professional, you’ll also be responsible for any back-and-forth. That means you’ll have to coordinate with:
- The buyer, who wants the best deal possible
- The buyer’s agent, who will use their expertise to advocate for the buyer
- The inspection company, which works for the buyer and will almost always find concerns with the house
- The appraiser, who assesses the property’s value to protect the lender
Instead of going toe-to-toe with all the above parties alone, lean on an expert. They’ll know what levers to pull, how to address everyone’s concerns, and when you may want to get a second opinion.
Bottom Line
Don’t go at it alone. If you’re planning to sell your house this winter, let’s connect so you have an expert by your side to guide you in today’s market.
 Facebook
 X
X
 Pinterest
 Copy Link