Today’s housing market is different than it was just a few months ago. And if you’re thinking about selling your house, that may leave you wondering what you need to do differently as a result. The answer is simple. Taking the time upfront to prep your house appropriately and create a solid plan can help bring in the greatest return on your investment.
Here are a few simple tips to make sure you maximize the sale of your house this fall.
1. Price It Right
One of the first things buyers will notice is the price of your house. That’s because the price sends a message to home shoppers. Pricing your house too high to begin with could put you at a disadvantage by discouraging buyers from making an offer. On the flip side, pricing your house too low may make buyers worry there’s some underlying issue or something wrong with the home.
Your goal in pricing your house is to gain the attention of prospective buyers and get them to make an offer. And with price growth and buyer demand moderating, as well as a greater supply of homes available for sale, pricing your home appropriately for where the market is today has become more important than ever before.
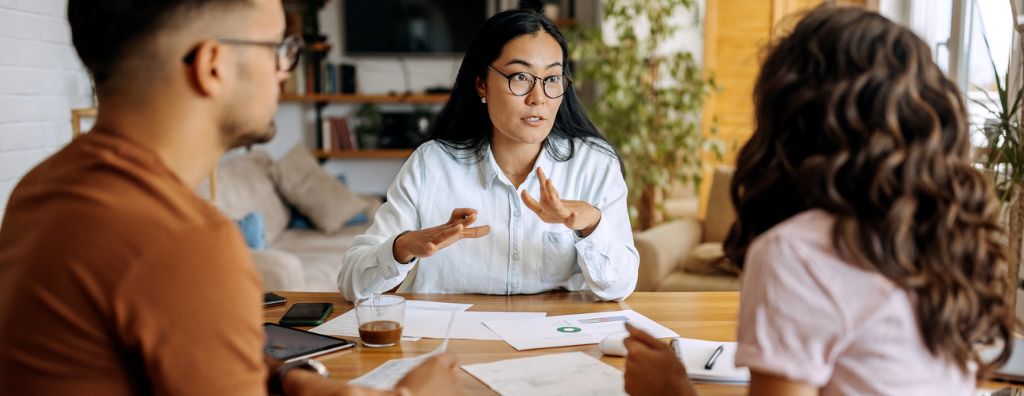
But how do you know that perfect number? Pricing your house isn’t a guessing game. It takes skill and expertise. Work with a trusted real estate advisor to determine the current market value for your home.
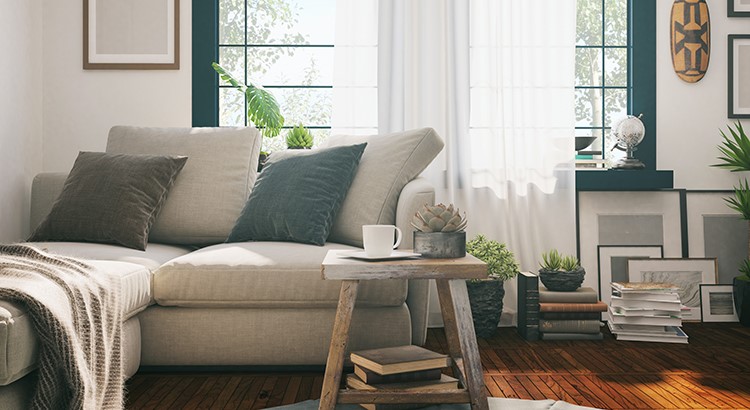
2. Keep It Clean
It may sound simple but keeping your house clean is another key to making sure it gets the attention it deserves. As realtor.com says in the Home Selling Checklist:
“When selling your home, it’s important to keep everything tidy for buyers, and you never know when a buyer is going to want to schedule a last-minute tour.”
Before each buyer visits, assess your space and determine what needs your attention. Wash the dishes, make the beds, and put away any clutter. Doing these simple things can reduce potential distractions for buyers.
For more tips, check out this checklist for preparing your house for sale. Ultimately an agent is your best resource for tailored advice, but this list can help get you started.
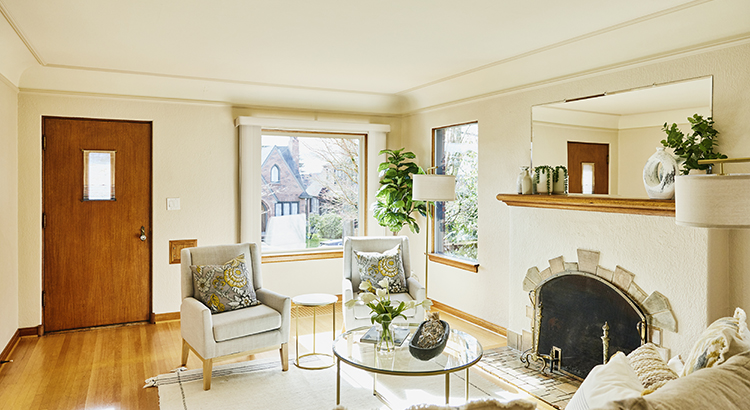
3. Help Buyers Feel at Home
Finally, it’s important for buyers to see all the possible ways they can make your house their next home. An easy first step to create this blank canvas is removing personal items, like pictures, awards, and sentimental belongings. It’s also a good idea to remove any excess furniture to help the rooms feel bigger and make sure there’s ample space for touring buyers to stand and look at the layout.
If you’re unsure what should be packed away and what can stay, consult your trusted real estate advisor. Spending the time on this step can pay off in the long run. As a recent article from the National Association of Realtors (NAR) explains:
“Staging is the art of preparing a home to appeal to the greatest number of potential buyers in your market. The right arrangements can move you into a higher price-point and help buyers fall in love the moment they walk through the door.”
Bottom Line
Selling a house requires prep work and expertise. If you’re looking to sell your house this season, let’s connect so you have advice on how to get it ready to list, how to help it stand out in today’s shifting market, and more.
 Facebook
 X
X
 Pinterest
 Copy Link