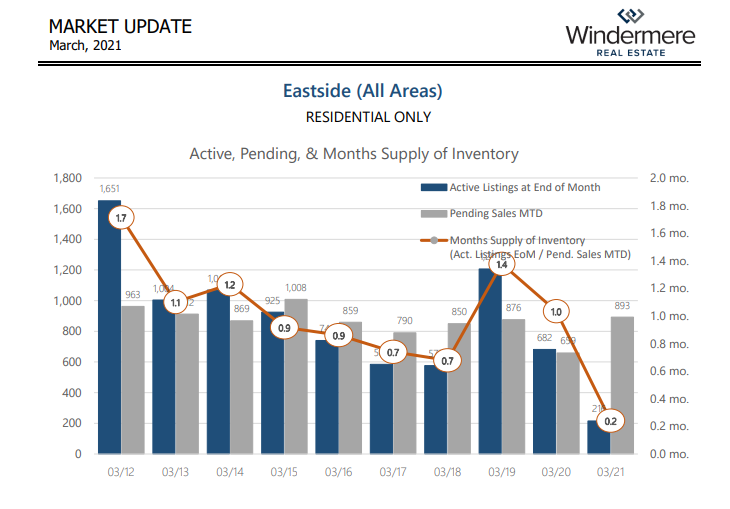
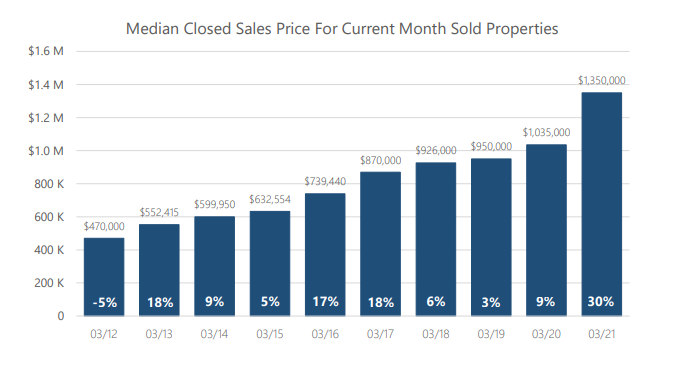
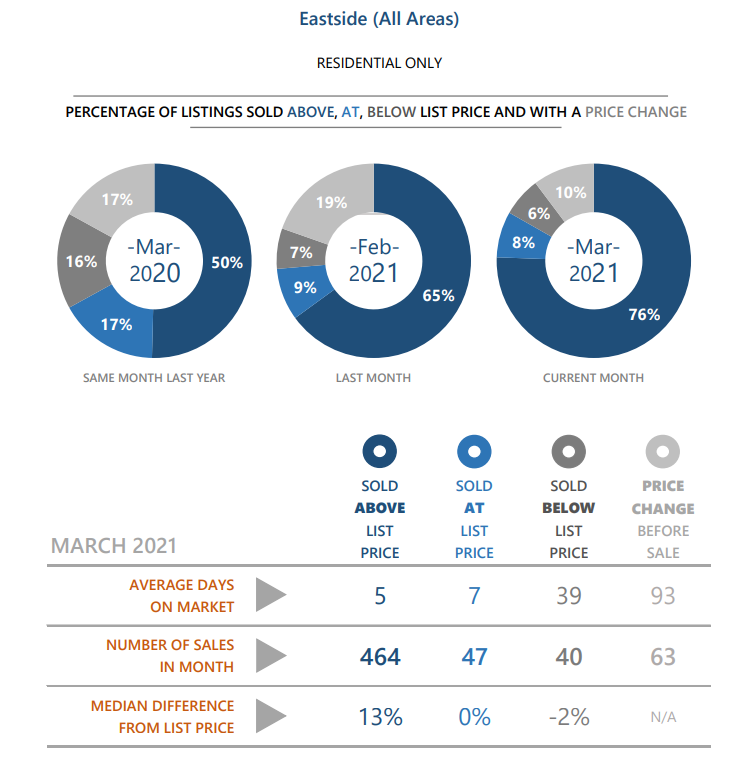
We finally have enough time/data for the stats to accurately reflect our extreme Seller’s Market. Let’s start with the insanely low 0.2 months of inventory, I believe that is a record low and clearly represents the market’s craziness. I usually dismiss the appreciation number, as it’s tricky to measure, but the 30% year-over-year appreciation seems spot on, as I would speculate that we have had 15% to 25% appreciation in 2021 alone.
What does this mean for you? If you are a homeowner thinking of selling, now is the time. If you are a homeowner thinking of a move-up buy, it’s a good time, you just need a smart, strategic plan. If you are a homeowner wanting to keep your home, keep an eye on capital gains. If you are a buyer, stay strong and work with a broker who is dialed-in and a good negotiator. Please contact me if you want to discuss further.
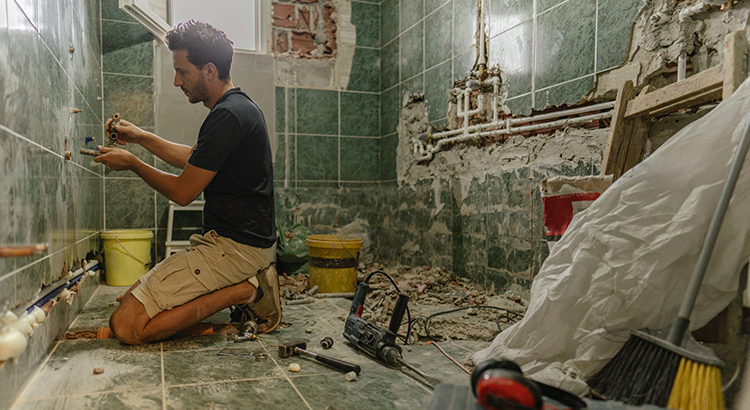
When thinking about selling, homeowners often feel they need to get their house ready with some remodeling to make it more appealing to buyers. However, with so many buyers competing for available homes right now, renovations may not be as vital as they would be in a more normal market. Here are two things to keep in mind if you’re thinking of selling this season.
1. There aren’t enough homes for sale right now.
A normal market has a 6-month supply of houses for sale, but today’s housing inventory sits far below that benchmark. According to the National Association of Realtors (NAR), there’s only a 1.9-month supply of homes available today. As a result, buyer competition is high and homes are only on the market for about 21 days, during which time many receive multiple offers from hopeful buyers.
In a competitive market that’s moving so quickly, it makes sense to sell your house when buyers are scooping homes up as fast as they’re being listed. Spending costly time and money on renovations before you sell might just mean you’ll miss your key window of opportunity. While certain repairs on your house may be important, your best move right now is to work with a real estate advisor to determine which improvements are truly necessary, and which ones are not likely to be deal-breakers for buyers.
Today, many buyers are more willing to take on home improvement projects themselves in order to get the home they’re after, even if it means putting in a little extra work. Home Advisor explains:
“When it comes to the number of home improvement projects completed, Gen Z homeowners are leading the pack, completing an average of 3.5 projects. Millennials closely follow Gen Z, taking on an average of 3.3 projects, followed by Gen X at 2.8 projects. Boomers completed an average of 2 projects, and the Silent Generation completed the fewest projects, on average, at 1.8 per household. Compared to 2019, millennials are spending 60% more on home improvement and doing on average 30% more projects.”
In this market, it may be wise to let future homeowners remodel the bathroom or the kitchen to make design decisions that are best for their specific taste and lifestyle. As a seller, your dollars and time might be better spent working on small cosmetic updates, like refreshing some paint and power washing the exterior. Instead of over-investing in your home with upgrades that the buyers may change anyway, work with a real estate professional to determine the key projects that will maximize your listing, without overdoing it.
2. Focus on getting a good return on your investment.
When planning any bigger projects to tackle, you and your real estate agent will want to discuss the potential return on your investment and if those projects are worth the cost. Some homes do need a kitchen or bathroom renovation, roof repairs, or other major work, but definitely not all of them. You might be surprised by how well your house could fair in today’s sellers’ market. Hanley Wood states:
“The 2020 Cost vs. Value report shows a predictable increase in costs for all 22 remodeling projects but a consistent dip in the perceived value of those projects at the time of home sale, as estimated by real-estate professionals in more than 100 metro areas across the U.S. This results in a slight downturn on the return on investment for nearly all projects relative to the trends we saw in last year’s report.”
Ideally, homeowners getting ready to move should try to avoid over-investing in big renovations if they won’t make that money back when they sell their house. According to the 2020 State of Home Spending report from Home Advisor:
“The average household spending on home services rose to $13,138, an increase over last year’s survey results, where homeowners who did projects spent $9,081 on average in 2019.”
Before you renovate, contact a local real estate professional to see if it’s the best course of action. You may find out that putting your house on the market as-is will help you sell quickly, and it may result in the best return on your investment. Every home is different, but a conversation with your agent is mission-critical to make sure you make the right moves when selling this season.
Bottom Line
We’re in a strong sellers’ market, and that means you have the leverage to sell your house on your terms. Let’s connect today to determine if renovating is really the best way to spend your time and money before you sell.
Last March, many involved in the residential housing industry feared the market would be crushed under the pressure of a once-in-a-lifetime pandemic. Instead, real estate had one of its best years ever. Home sales and prices were both up substantially over the year before. 2020 was so strong that many now fear the market’s exuberance mirrors that of the last housing boom and, as a result, we’re now headed for another crash.
However, there are many reasons this real estate market is nothing like 2008. Here are six visuals to show the dramatic differences.
1. Mortgage standards are nothing like they were back then.
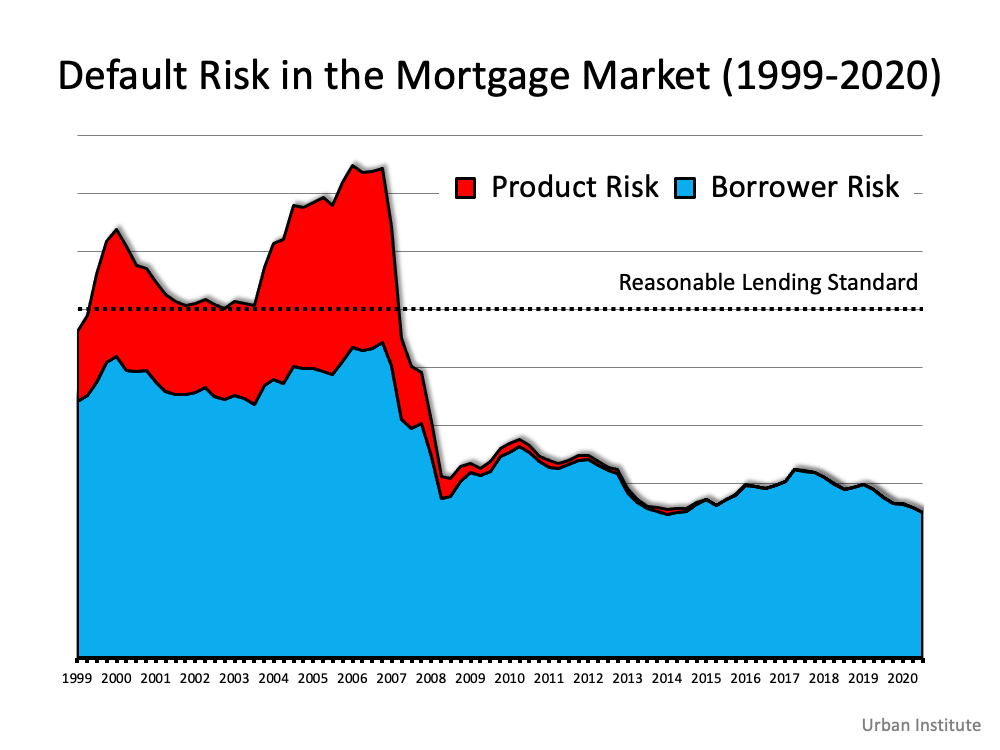
During the housing bubble, it was difficult not to get a mortgage. Today, it’s tough to qualify. Recently, the Urban Institute released their latest Housing Credit Availability Index (HCAI) which “measures the percentage of owner-occupied home purchase loans that are likely to default—that is, go unpaid for more than 90 days past their due date. A lower HCAI indicates that lenders are unwilling to tolerate defaults and are imposing tighter lending standards, making it harder to get a loan. A higher HCAI indicates that lenders are willing to tolerate defaults and are taking more risks, making it easier to get a loan.”
The index shows that lenders were comfortable taking on high levels of risk during the housing boom of 2004-2006. It also reveals that today, the HCAI is under 5 percent, which is the lowest it’s been since the introduction of the index. The report explains:
“Significant space remains to safely expand the credit box. If the current default risk was doubled across all channels, risk would still be well within the pre-crisis standard of 12.5 percent from 2001 to 2003 for the whole mortgage market.”
This is nothing like the last time.
2. Prices aren’t soaring out of control.
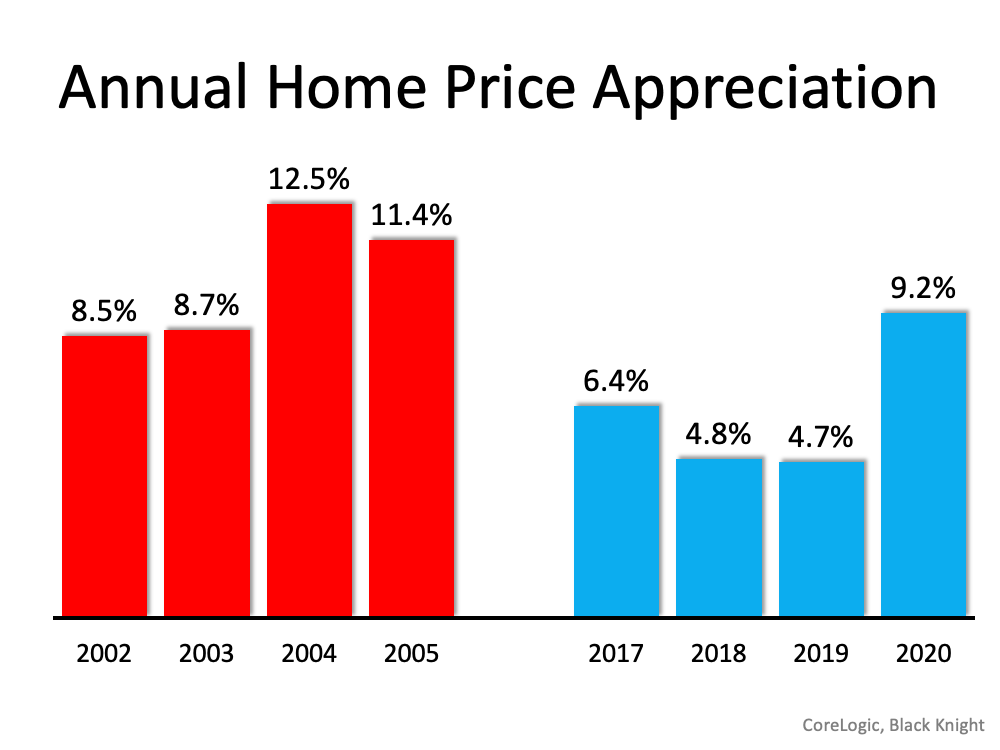
Below is a graph showing annual home price appreciation over the past four years compared to the four years leading up to the height of the housing bubble. Though price appreciation was quite strong last year, it’s nowhere near the rise in prices that preceded the crash.There’s a stark difference between these two periods of time. Normal appreciation is 3.8%. So, while current appreciation is higher than the historic norm, it’s certainly not accelerating out of control as it did in the early 2000s.
This is nothing like the last time.
3. We don’t have a surplus of homes on the market. We have a shortage.
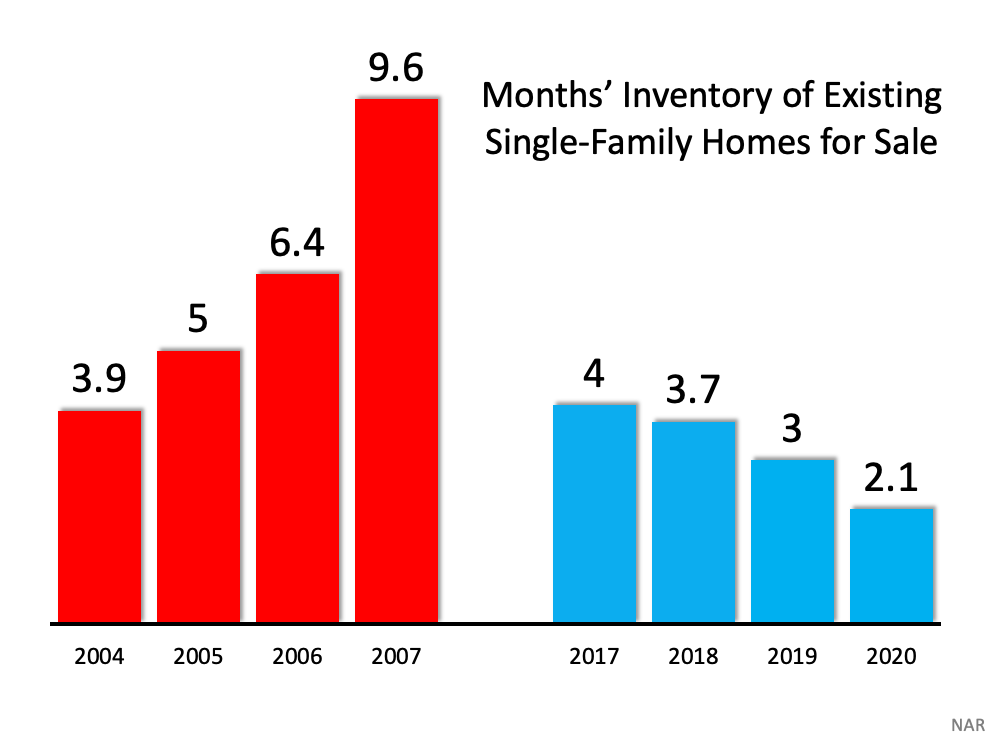
The months’ supply of inventory needed to sustain a normal real estate market is approximately six months. Anything more than that is an overabundance and will causes prices to depreciate. Anything less than that is a shortage and will lead to continued appreciation. As the next graph shows, there were too many homes for sale in 2007, and that caused prices to tumble. Today, there’s a shortage of inventory, which is causing an acceleration in home values.This is nothing like the last time.
4. New construction isn’t making up the difference in inventory needed.
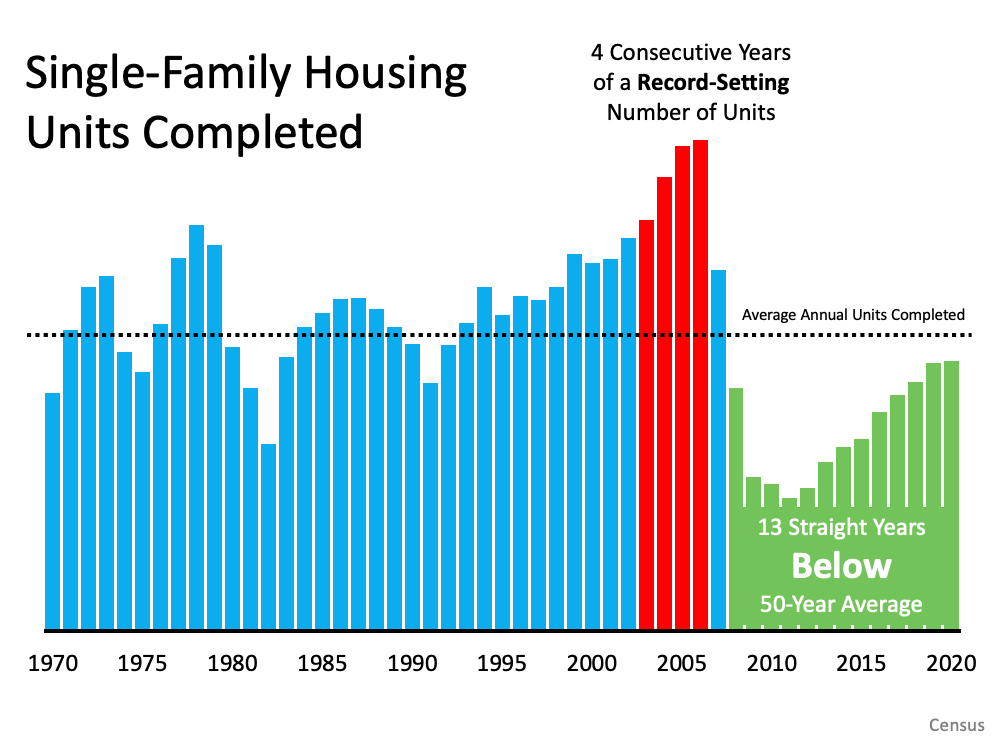
Some may think new construction is filling the void. However, if we compare today to right before the housing crash, we can see that an overabundance of newly built homes was a major challenge then, but isn’t now.This is nothing like the last time.
5. Houses aren’t becoming too expensive to buy.
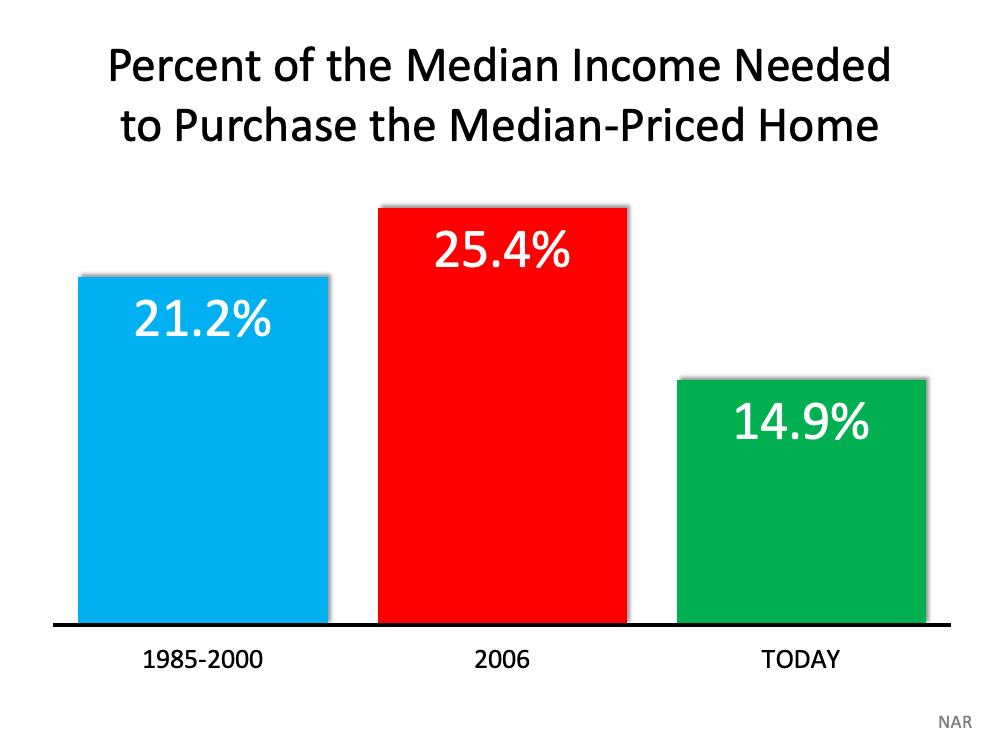
The affordability formula has three components: the price of the home, the wages earned by the purchaser, and the mortgage rate available at the time. Fifteen years ago, prices were high, wages were low, and mortgage rates were over 6%. Today, prices are still high. Wages, however, have increased, and the mortgage rate is about 3%. That means the average homeowner pays less of their monthly income toward their mortgage payment than they did back then. Here’s a chart showing that difference:As Mark Fleming, Chief Economist for First American, explains:
“Lower mortgage interest rates and rising incomes correspond with higher house prices as home buyers can afford to borrow and buy more. If housing is appropriately valued, house-buying power should equal or outpace the median sale price of a home. Looking back at the bubble years, house prices exceeded house-buying power in 2006, but today house-buying power is nearly twice as high as the median sale price nationally.”
This is nothing like the last time.
6. People are equity rich, not tapped out.
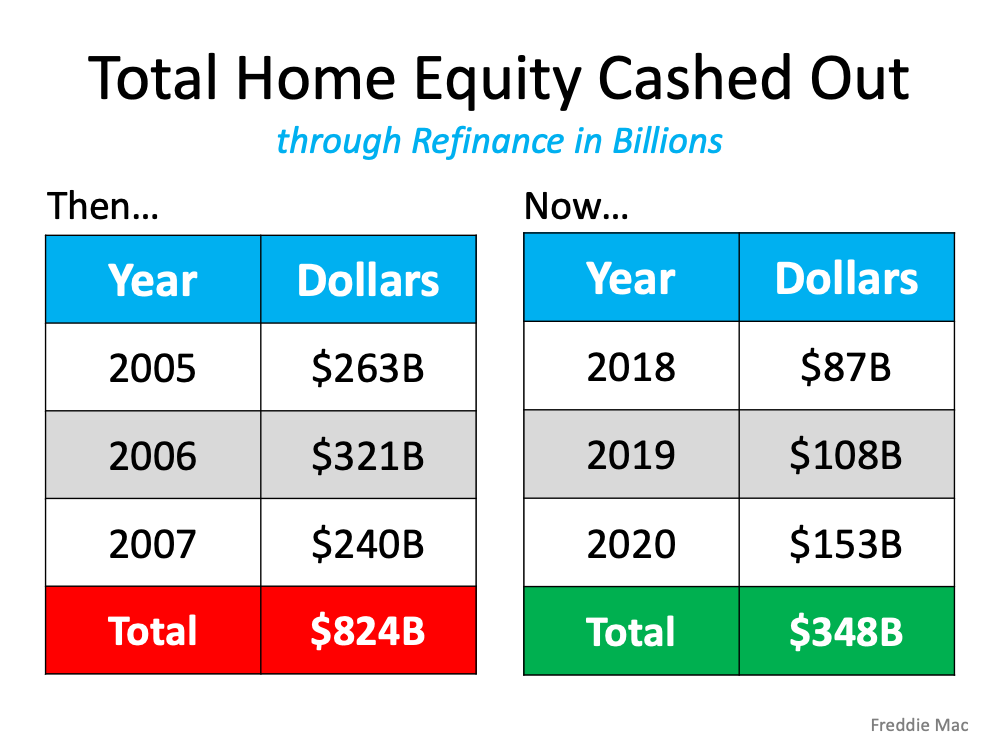
In the run-up to the housing bubble, homeowners were using their homes as personal ATM machines. Many immediately withdrew their equity once it built up, and they learned their lesson in the process. Prices have risen nicely over the last few years, leading to over 50% of homes in the country having greater than 50% equity – and owners have not been tapping into it like the last time. Here’s a table comparing the equity withdrawal over the last three years compared to 2005, 2006, and 2007. Homeowners have cashed out almost $500 billion dollars less than before:During the crash, home values began to fall, and sellers found themselves in a negative equity situation (where the amount of the mortgage they owed was greater than the value of their home). Some decided to walk away from their homes, and that led to a wave of distressed property listings (foreclosures and short sales), which sold at huge discounts, thus lowering the value of other homes in the area. With the average home equity now standing at over $190,000, this won’t happen today.
This is nothing like the last time.
Bottom Line
If you’re concerned that we’re making the same mistakes that led to the housing crash, take a look at the charts and graphs above to help alleviate your fears.


 Facebook
 X
X
 Pinterest
 Copy Link

![How to Be a Competitive Buyer in Today’s Housing Market [INFOGRAPHIC] | MyKCM](https://files.mykcm.com/2021/03/10135710/20210312-MEM-1046x2024.png)