Facebook
 X
X
 Pinterest
 Copy Link

Selling your house is no simple task. And when you sell on your own – known as a FSBO (or For Sale by Owner) – you’re responsible for handling some of the more difficult aspects of the process without the expert guidance you need.
The 2021 Profile of Home Buyers and Sellers from the National Association of Realtors (NAR) surveys homeowners who recently sold their house on their own and asks what difficulties they faced. Those sellers say some of the biggest headaches are prepping their house for sale, pricing it right, and handling the required paperwork.
Working with an agent is the best way to ensure you have an expert on your side to guide you at every turn. Agents have the skills and knowledge that are essential to navigating each step with ease, efficiency, and accuracy. Here are just a few things a real estate agent will do to make sure you get the most out of your sale.
1. Make the Best First Impression
Selling your house requires a significant amount of time and effort. Doing it right takes expertise and an understanding of today’s buyers. Your agent knows the answers to common questions, such as:
- Do I need to take down my personal art?
- How much landscaping does my house need?
- What colors should I paint my walls?
Your time and money are important, and you don’t want to waste either one focusing on the wrong things. A real estate advisor relies on their experience to answer these questions and more, allowing you to make the right investments to prep your house before you list.
2. Maximize Your Buyer Pool – and Your Sale
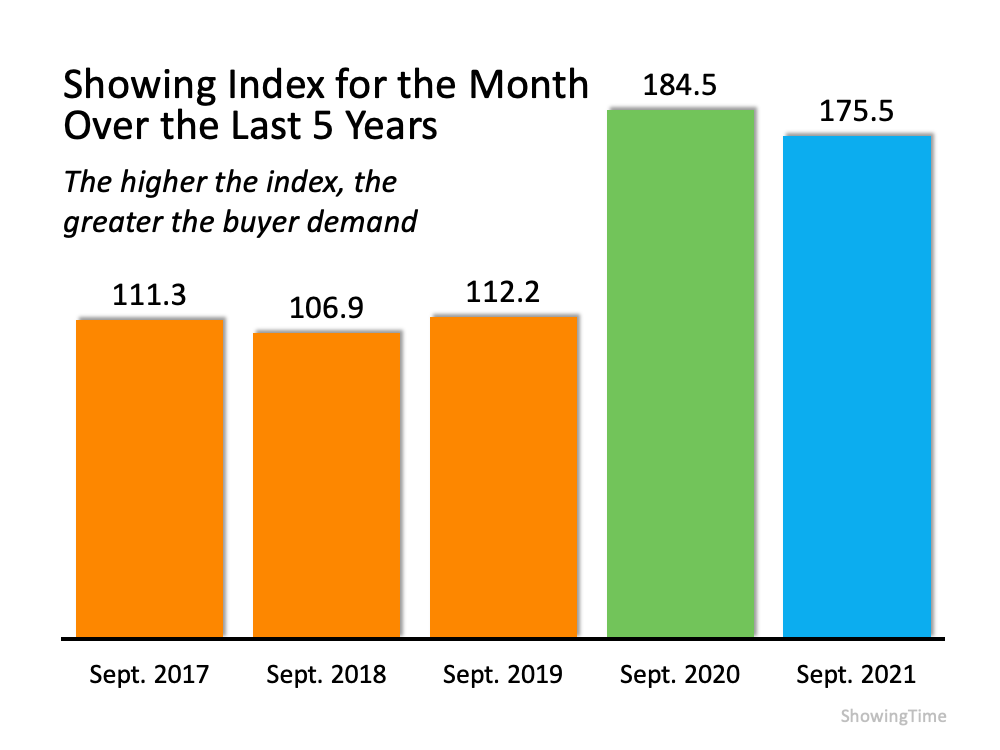
Today, the average home is getting 3.6 offers per sale according to recent data from NAR. That’s great news if you’re planning to sell, since the more offers you receive, the more likely you are to sell your house in a bidding war, and for a higher price.
Real estate agents have an assortment of tools at their disposal, like social media followers and agency resources, that will ensure your house is viewed by the most buyers. Without access to these tools and your agent’s marketing expertise, your buyer pool – and your home’s selling potential – is limited.
3. Understand the Documentation, Including the Fine Print
Today, when a house is sold, more disclosures and regulations are mandatory, meaning the number of legal documents to juggle is growing. It’s hard to understand all the requirements and fine print (especially if you’re not an expert). That’s why your advisor is an invaluable guide.
Your agent knows exactly what needs to happen, what all the paperwork means, and can work through it efficiently. They’ll help you review the documentation and avoid any costly missteps that could happen if you tackle it on your own.
4. Act as Your Expert Negotiator
If you sell without an agent, you’ll also be solely responsible for all negotiations. That means you have to coordinate with:
- The buyer, who wants the best deal possible
- The buyer’s agent, who will use their expertise to advocate for the buyer
- The inspection company, which works for the buyer and will almost always find concerns with the house
- The appraiser, who assesses the property’s value to protect the lender
Instead of going toe-to-toe with all these parties alone, lean on an expert. Your agent relies on experience and training to make the right moves throughout the negotiation. They’ll know what levers to pull, how to address each individual concern, and when you may want to get a second opinion. When you sell your house yourself, you’ll need to be prepared to have these conversations on your own.
5. Price It Right
Real estate professionals have the expertise to price your house accurately and competitively. To do so, they compare your house to recently sold homes in your area and factor in the current condition of your house. These factors are key to making sure your house is priced to move quickly and get you the maximum return on your investment.
When you sell as a FSBO, you’re operating without this advantage. That could cost you in the long run if you price your house too high or too low.
Bottom Line
There’s a lot that goes into selling your house, and it takes time, effort, and expertise to truly maximize your sale. Instead of tackling it alone, let’s connect to make sure you have an expert on your side.


![A Happy Tail: Pets and the Homebuying Process [INFOGRAPHIC] | MyKCM](https://files.mykcm.com/2021/12/08135318/20211210-MEM-1046x1910.png)

![A Checklist for Selling Your House This Winter [INFOGRAPHIC] | MyKCM](https://files.mykcm.com/2021/12/01091834/20211203-MEM-1046x1572.png)